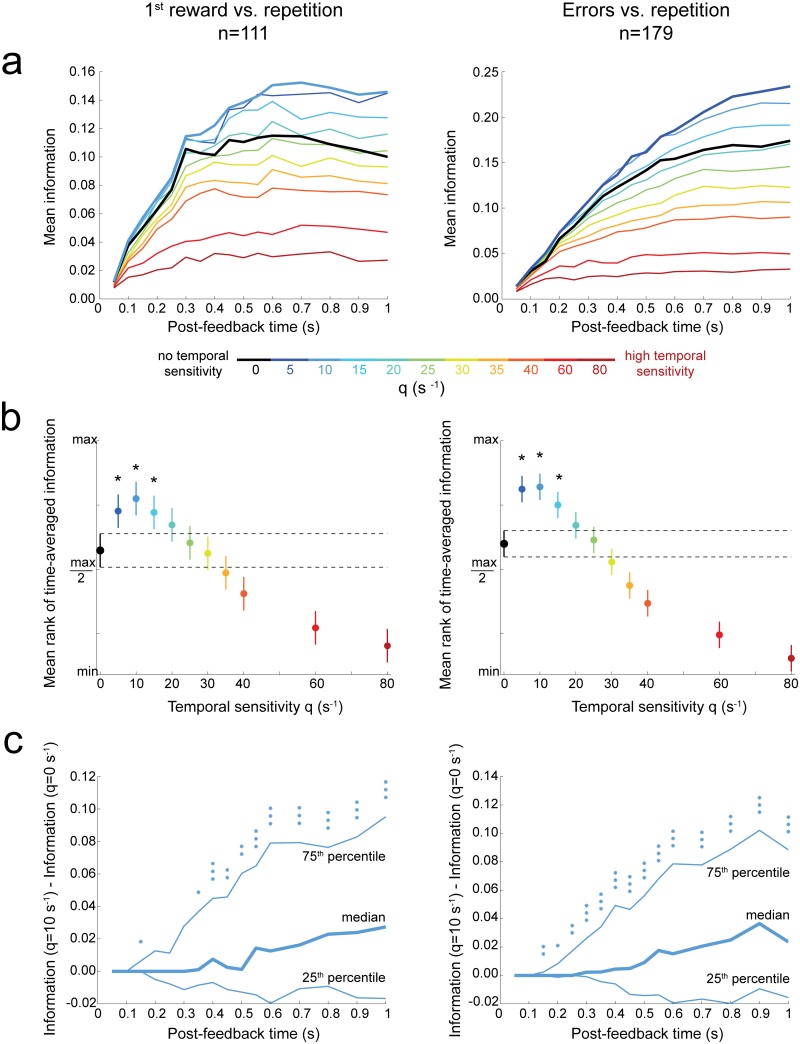
Fig 4. Optimal temporal sensitivity improves decoding of single unit behavioral adaptation signals.
(a) Time course of the mean information (averaged among significant cells) as a function of the decoding temporal sensitivity (q). Information values were computed over increasing post-feedback time windows (ending at the time indicated by the x-axis). Left: Discrimination between first reward and repetition task epochs. Right: Discrimination between error and repetition task epochs. (b) Time-averaged information <I>t (Table 1) for different temporal sensitivities (q). The ordinate axis is the normalized mean rank of <I>t. After a Friedman test, post-hoc comparisons with Tukey’s honestly significant difference correction were used for the 95% confidence intervals. Temporal sensitivities q > 0 that were performing significantly better compared to q = 0 are indicated by a star. (c) Distribution of the difference of information between optimal temporal decoding (qopt ≈ 10 s-1) and spike-count decoding (q = 0 s-1). Asterisks indicate the significance of signed-rank tests (the null hypothesis is the symmetric distribution around zero): *, p ≤ 0.05; **, p ≤ 0.01; ***, p ≤ 0.001. See also S1–S7 Figs and S1 Table.

