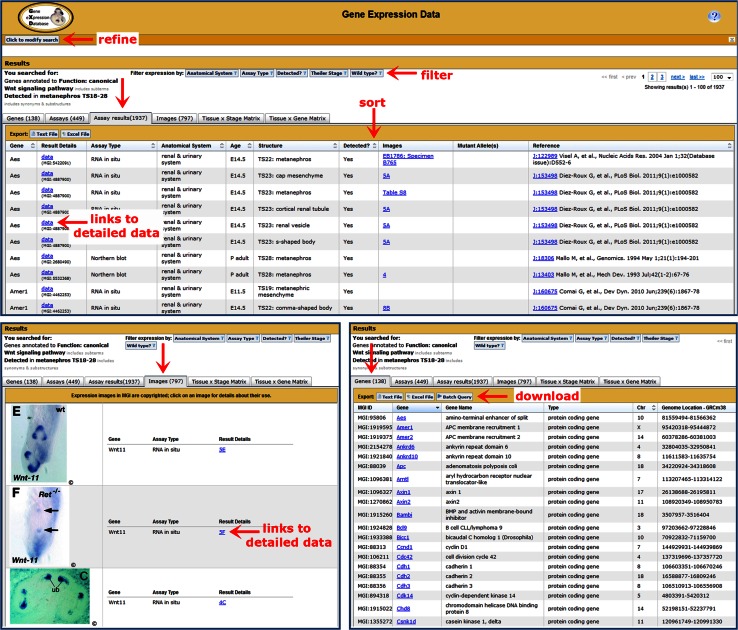
Fig. 5.
Gene Expression Data searches return summaries for the expression results that match the search parameters, organized under six separate tabs. Each summary presents the data with a different level of detail and focus. The number of matching records is indicated in the tab header. The Assay results tab (upper) is displayed by default. It lists the gene studied, the assay type used, the anatomical system, age and tissue examined, indicates whether expression was detected, provides a link to the corresponding images, lists the mutant alleles of the specimen (if applicable), and provides the reference from which the data were derived. Links in the Result Details and Images columns lead to detailed expression records, such as the one shown in Fig. 2. Arrowheads in column headers indicate that the column is sortable (one set is indicated). The Assay results tab (as well as the Genes tab) allows for export of results in text and spread sheet formats (buttons in table header). The Images tab (lower left) shows all the images that match the search criteria, together with the gene(s) examined in that image and the assay type used and provides a link to the corresponding part of the detailed expression record. The Genes tab (lower right) provides a list of the genes that match the query. The export feature can forward the genes list to either the MGI batch query or MouseMine, thereby allowing searches for additional information, such as the function, phenotype and/or disease terms associated with the genes of interest. Expression summaries can be refined using the “Click to modify search” button or using the filter options provided on the summary page. The content of all of the summaries will change accordingly. To filter by anatomical structures or by gene, use the row and column filters available on the Tissue × Stage Matrix (Fig. 6) or Tissue × Gene Matrix (Fig. 7) respectively

