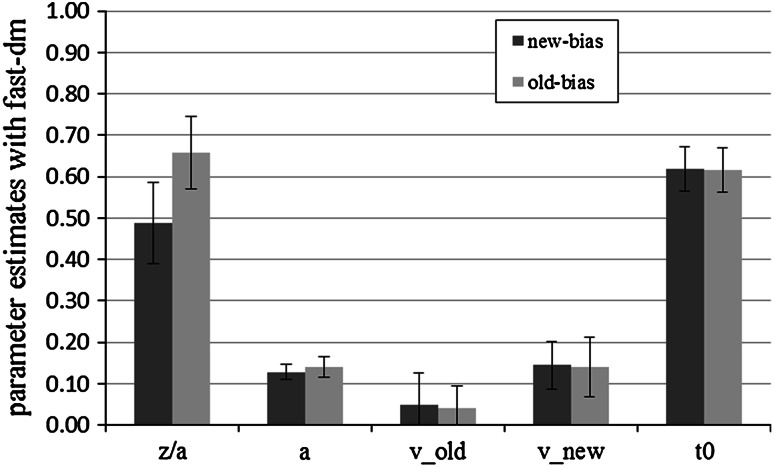
Fig. 2.
Mean fast-dm parameter estimates for new-bias and old-bias conditions in Experiment 1. Bars represent standard deviation. We show the absolute values of the drift rates. z/a represents the bias parameter, a the threshold parameter, v old the drift rate for old items, v new the drift rate for new items, and t 0 the response-time constant

