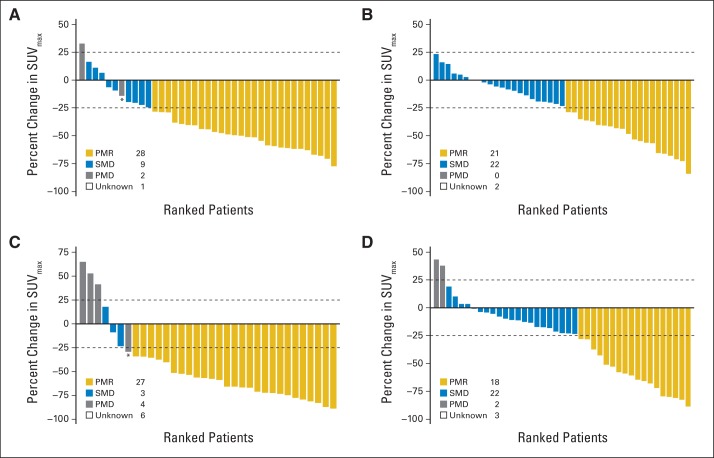
Fig A1.
Waterfall plots of change in maximum standardized uptake value (ΔSUVmax) relative to baseline. Dashed lines denote European Organisation for Research and Treatment of Cancer cutoffs for metabolic response (−25%) and progression (+25%). Asterisks denote patients who were considered metabolic progressors on the basis of new lesion(s). (A) Cohort 1 and (B) cohort 2 ΔSUVmax at week 1 v baseline; (C) cohort 1 and (D) cohort 2 ΔSUVmax at week 8 v baseline. PMD, progressive metabolic disease; SMD, stable metabolic disease; PMR, partial metabolic response.

