
Figure 2.
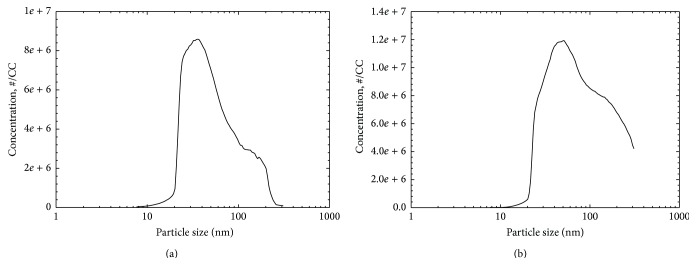
Particle size distribution of graphene oxide in low- (a) and high-concentration (b) chambers measured using scanning nanoparticle spectrometer (SNPS).
Official websites use .gov
A
.gov website belongs to an official
government organization in the United States.
Secure .gov websites use HTTPS
A lock (
) or https:// means you've safely
connected to the .gov website. Share sensitive
information only on official, secure websites.
Particle size distribution of graphene oxide in low- (a) and high-concentration (b) chambers measured using scanning nanoparticle spectrometer (SNPS).