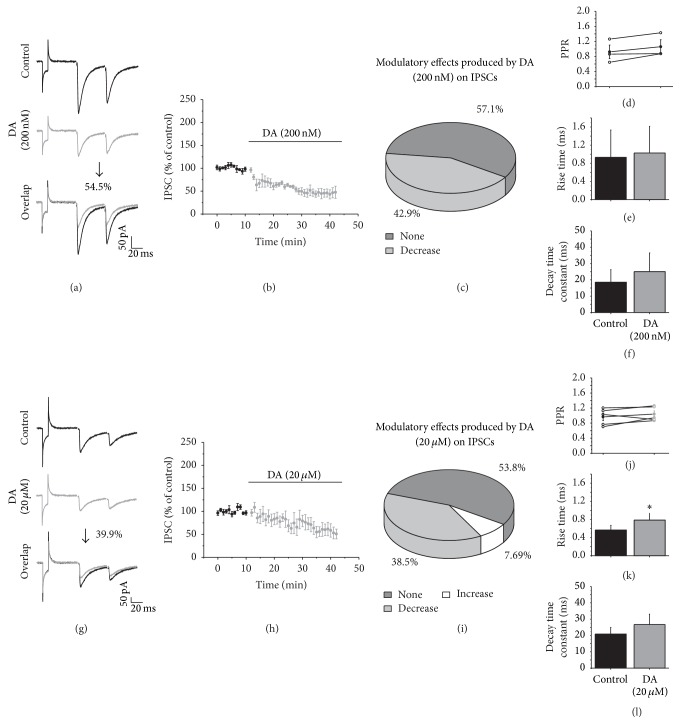
Figure 2.
DA modulation of striatal GABAergic transmission. (a and g) show IPSCs traces in the control (top) and in the presence of DA ((a) 200 nM or (g) 20 μM in the middle) and an overlap of the recordings (bottom). (b and h) illustrate the time course of the DA effects. Data are presented as percentage of change compared with the control in all graphs. (c and i) Pie charts illustrate the distribution of the modulatory effects of DA (200 nM and 20 μM, resp.) on the IPSC amplitude. (d and i) display the PPR comparison of the IPSCs in the control and in the presence of DA. (e and k) The rise time and (f and l) the decay time constants of the IPSCs in the control and in the presence of DA. In this figure and the rest H V = −70 mV, and recordings were in presence of CNQX (10 μM) and APV (50 μM).

