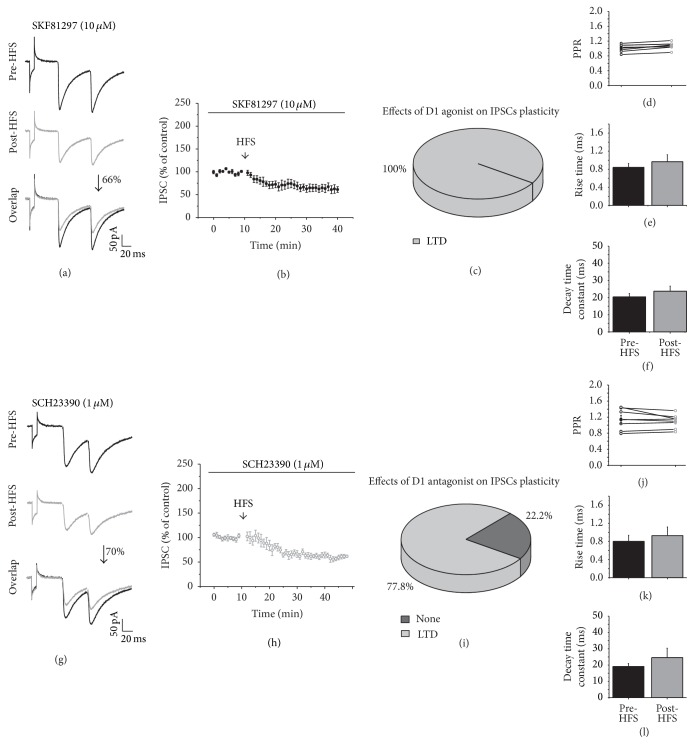
Figure 6.
D1 modulation of GABAergic synaptic plasticity. (a and g) show representative IPSC traces before HFS (top) and after HFS (middle) and an overlap of the recordings (bottom), all in the presence of the D1 agonist SKF81297 (10 μM) and the D1 antagonist SCH23390 (1 μM), respectively. (b and h) illustrate the time course of the effects of HFS on the IPSC amplitude in the presence of SKF81297 and SCH23390, respectively. (c and i) display the distribution in percentages of the types of plasticity that were generated in the presence of the D1 agonist or antagonist. (d and j) are the PPR comparison of the IPSCs before and after HFS in presence of SKF81297 and SCH23390, respectively. (e and k) are the rise time, while (f and l) are the decay time in the presence of SKF81297 and SCH23390, respectively, before and after HFS.

