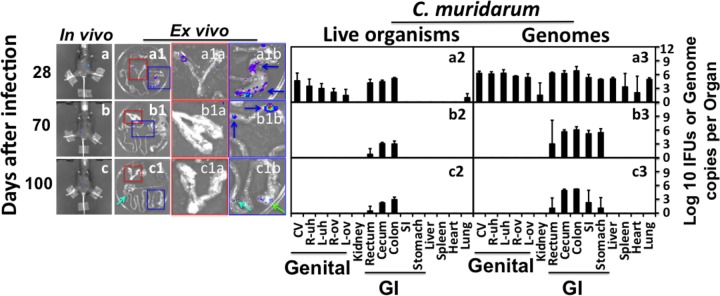
FIG 4.

Monitoring the luciferase-expressing C. muridarum infection in C57BL/6J mice. Groups of female C57BL/6J mice were intravaginally infected with luciferase-expressing C. muridarum. On different days after infection as indicated on the left, the whole-body imaging for bioluminescence intensity was taken as described in Fig. 1 legend (a to c; only one representative image is shown). A group of 3 or 4 mice were sacrificed at each time point for harvesting the internal organs for ex vivo imaging as described in Fig. 2 legend (a1 to c1). Areas marked with red or blue squares were enlarged and are presented in panels a1a to c1a (covering the genital tract) or a1b to c1b (GI tract tissues). Blue arrows point to cecum or colon, green arrows to stomach, and greenish blue arrows to small intestines. At each time point, only one representative mouse-derived in vivo whole-body image and one ex vivo imaging of the organs (from the same mouse) are shown. After ex vivo imaging, the same organs were subjected to tissue homogenization as described in Fig. 3 legend. The homogenates from vagina-cervix (CV), right uterine horn (R-uh), left uterine horn (L-uh), right ovary and oviduct (R-ov), left ovary and oviduct (L-ov), kidney, rectum, cecum, colon, small intestine (SI), stomach, liver, spleen, heart, and lung as listed along the x axis at the bottom were titrated for both chlamydial live organisms (a2 to c2) and genome copies (a3 to c3). The results were expressed in total number per organ/tissue (log10) and are displayed along the corresponding y axis. Organs/tissues belonging to the genital and gastrointestinal tracts were marked with “Genital” and “GI,” respectively. Note that by day 28, live organisms were detected mainly in the genital and GI tracts but only in the GI tract by day 56 and thereafter.
