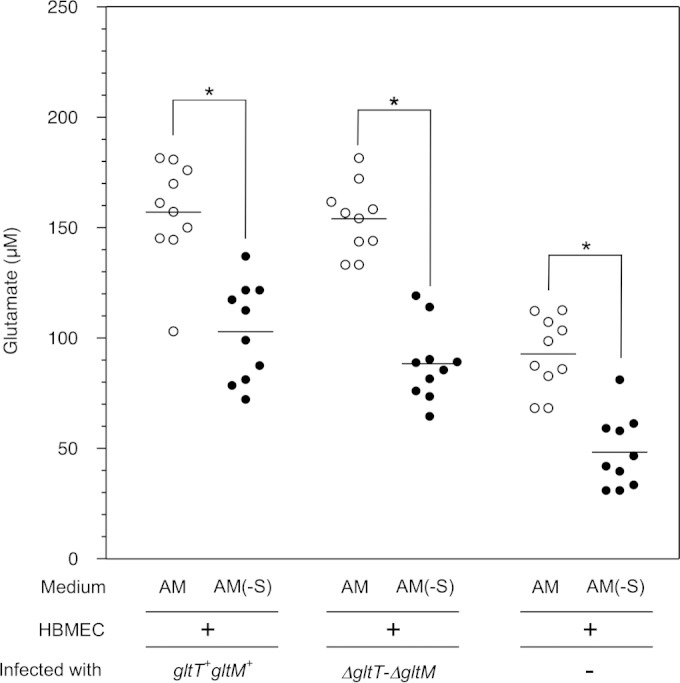
FIG 2.

Measurement of glutamate concentrations in AM. The glutamate concentrations were determined in the supernatants of the AM and AM(−S) used for Fig. 1. Each circle represents the glutamate concentration in one sample. The open and solid circles indicate the glutamate concentrations in AM and AM(−S), respectively. Statistical analyses were performed with a two-tailed Student t test; *, P < 0.0001. Horizontal lines indicate the means.
