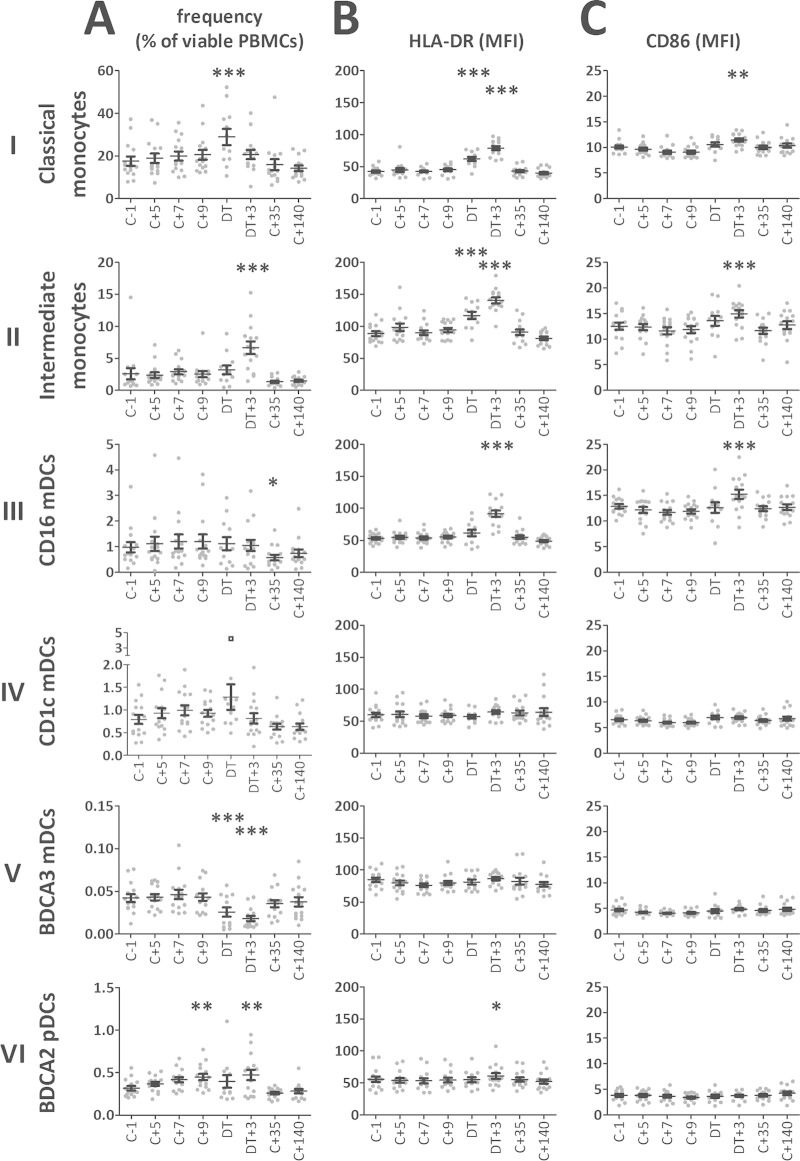
FIG 2.
Kinetics of APC subset frequencies and expression of activation markers during and after CHMI. (A) Kinetics of APC subset frequency (percentages of viable PBMCs). (B) Kinetics of HLA-DR expression (geometric mean fluorescence intensity [MFI]) of the six APC subsets. (C) Kinetics of CD86 expression (MFI) of the six APC subsets. Data are presented for each individual donor (gray dots) and as means (n = 15) with standard errors of the means (SEM) (black error bars). *, P < 0.05; **, P < 0.01; ***, P < 0.001 (one-way ANOVA with Dunnett's post hoc test compared to baseline [C −1]). Inclusion of the outlier (black square) in the CD1c mDC frequency in the statistical analysis renders the increase on the DT significant. C, challenge; DT, day of treatment.

