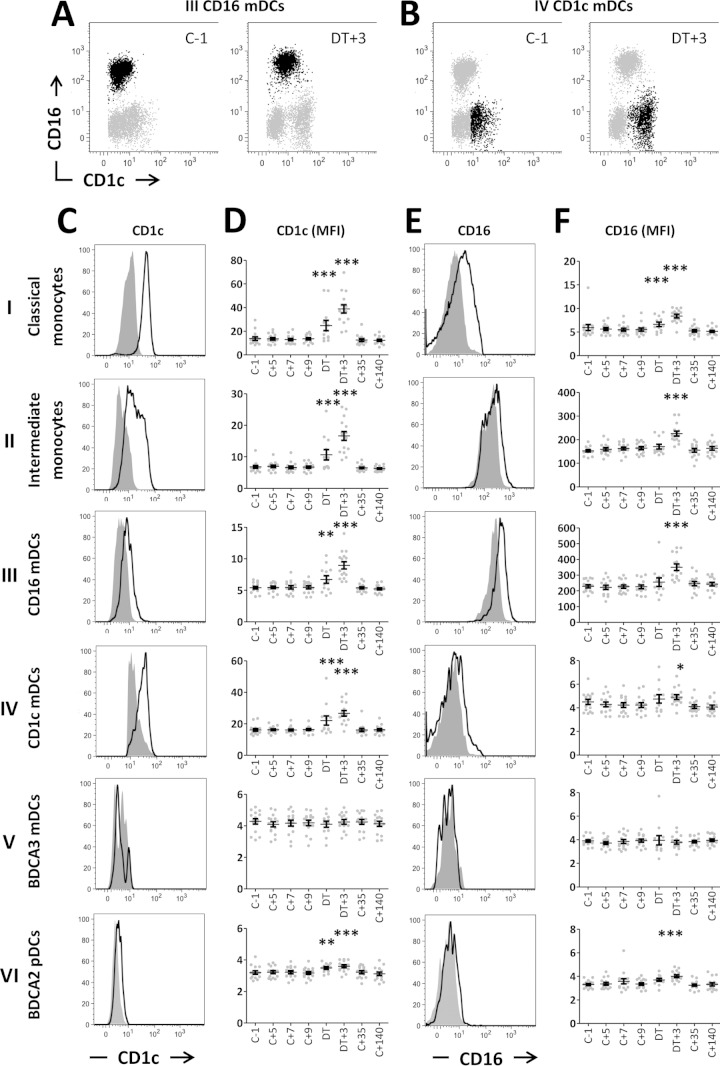
FIG 3.
CD1c and CD16 expression on APCs during CHMI. (A and B) Representative plots showing CD1c and CD16 expression on CD16 mDCs (black dots) (A) or CD1c mDCs (black dots) (B) at baseline (C −1) and peak activation (DT +3). Gray dots in panels A and B show all DCs. (C) Expression of CD1c on APC subsets. (D) Expression (geometric mean fluorescence intensity [MFI]) of CD1c on APC subsets over time. (E) CD16 expression on APC subsets. (F) Expression (MFI) of CD16 on APC subsets over time. Panels C and E show representative histogram plots from one donor at baseline (gray) and DT +3 (bold line). Data in panels D and F are presented for each individual donor (gray dots) and as means (n = 15) with SEM (black error bars).*, P < 0.05; **, P < 0.01; ***, P < 0.001 (one-way ANOVA with Dunnett's post hoc test compared to baseline [C −1]). C, challenge; DT, day of treatment.

