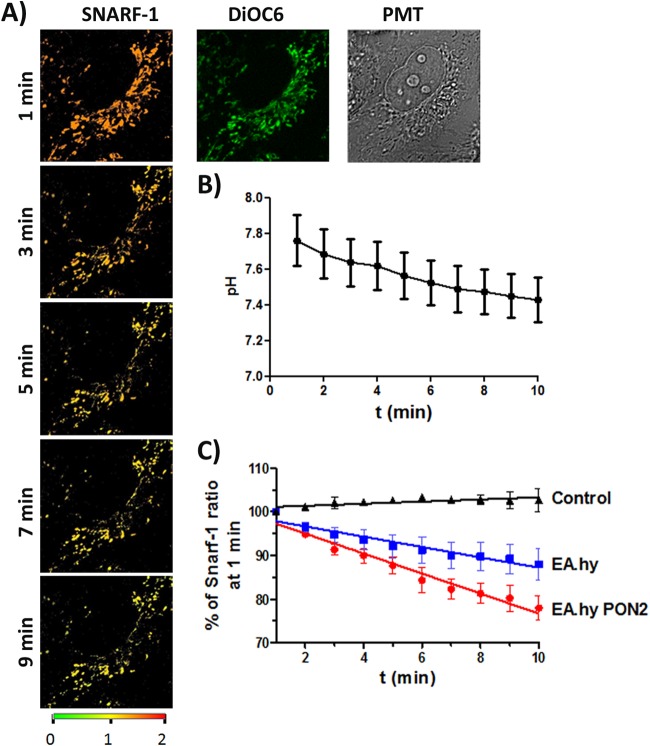
FIG 6.
3OC12 induces PON2-mediated mitochondrial acidification. (A) EA.hy 926 cells were loaded with the mitochondrial ratiometric pH indicator SNARF-1 (orange/red) and mitochondrial dye DiOC6 (green) as indicated in Materials and Methods. Cells were treated with 3OC12 (50 μM). pHm changes were observed in time-lapse 3D confocal imaging for the indicated duration (representative images for 1, 3, 5, 7, 9 min are shown). A change of SNARF-1 ratiometric fluorescence from orange/red to yellow/green indicates acidification. (B) Quantification of pHm changes during 3OC12 treatment, with a typical trace for EA.hy cells. (C) EA.hy 926 cells with PON2 overexpression (red curve) show an increased rate of 3OC12-induced pHm drop compared to that in control EA.hy (blue; empty plasmid) or solvent (0.1% methanol)-treated controls (black). Symbols show means ± standard errors of the means of 8 to 15 individual experiments demonstrating the SNARF-1 ratiometric pHm response; slopes of linear regression curves differ with a P of 0.004 for naive versus EA.hy PON2 cells. t, time.

