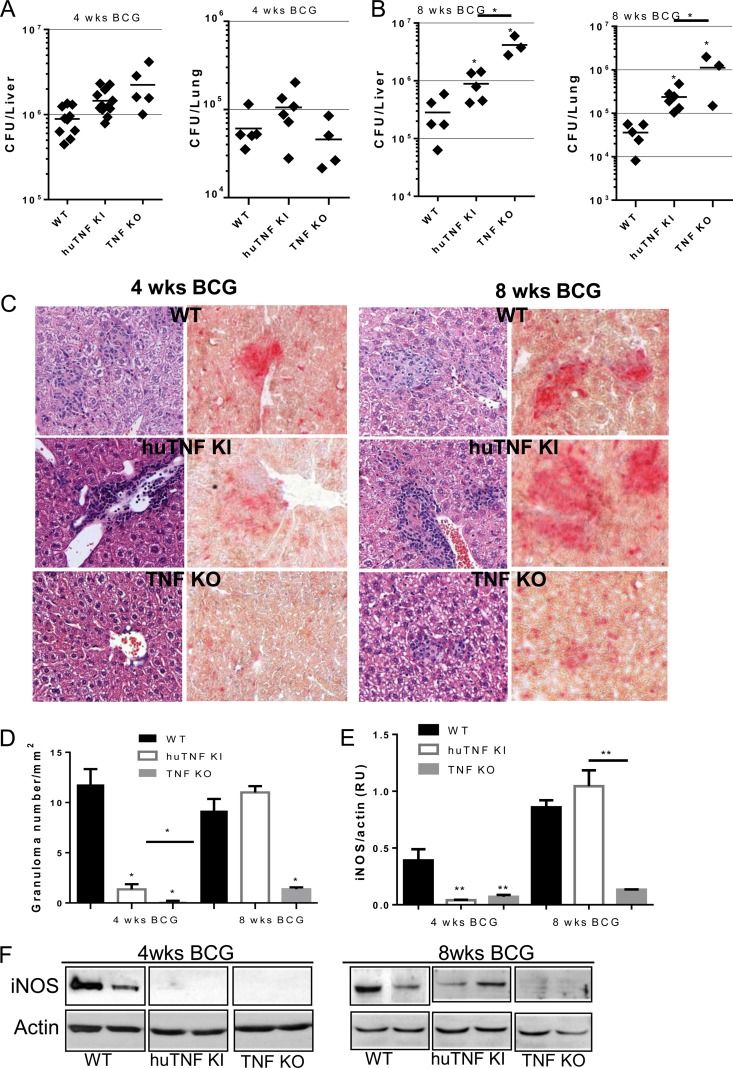
FIG 3.
Bacterial load, granuloma formation, and iNOS expression in huTNF KI mice during BCG infection. (A and B) Liver and lung bacterial loads in WT, huTNF KI, and TNF KO mice at 4 weeks (A) and 8 weeks (B) after BCG infection (5 × 10⁶ CFU of BCG Sofia strain) (n = 9 for WT and huTNF KI mice, n = 4 for TNF KO mice). (C) Microscopic examination of liver granulomas in WT, huTNF KI, and TNF KO mice after H&E staining (left) and acid phosphatase activity (right) on liver sections at 4 and 8 weeks after infection. The liver sections show the granulomas in WT mice in comparison with the granulomas in huTNF KI mice but absence in TNF KO mice correlating with the acid phosphatase activity of active monocytes/macrophages forming granulomas (activity is colored in red). The images are representative of those from two experiments (n = 6 to 7 per group). Magnifications, ×400. (D) The number of liver granulomas in WT, huTNF KI, and TNF KO mice was assessed at 4 and 8 weeks postinfection (n = 6 for WT mice, n = 10 for huTNF KI mice, n = 3 for TNF KO mice). (E) Level of hepatic iNOS protein expression relative to the level of actin expression at 4 and 8 weeks after BCG infection on Western blots. Protein expression was determined with Quantity One analysis software in three different experiments. RU, relative units. (F) Representative Western blot revealing iNOS and actin (n = 8 for WT and huTNF KI mice, n = 3 for TNF KO mice). Bar graphs show means ± SEMs. *, P < 0.05 versus WT mice; **, P < 0.01 versus WT mice.

