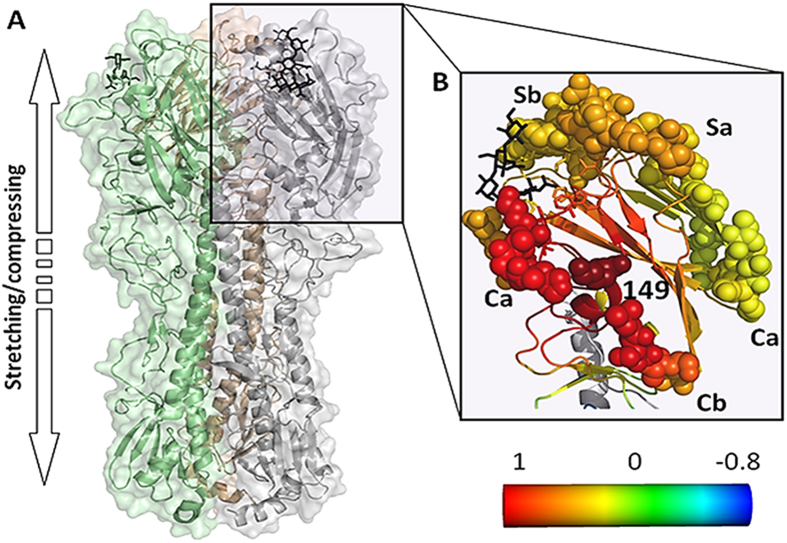
Figure 5. Position HA149 is a central hinge in the RBD, displaying correlated dynamic fluctuations with antigenic sites and receptor binding site residues.
An overview of the HA trimer from A/California/04/2009 structure [Protein Data Bank (PDB) accession number 3UBE] in cartoon representation with each subunit in a different color. The RBDs, mediating the binding to the host cell, are at the top and the sialic acid receptors are displayed using stick model representation. Normal mode analysis revealed spring motion along the arrow, considered to be important here (a). Correlation between the dynamic fluctuations of position 149 and the other RBD residues, color-coded with red-through-blue corresponding to the most positively-through-most negatively cooperative motions (b). Amino acids of known antigenic sites are presented as spheres, and the known sialic acid-binding residues are marked with sticks; binding site residues that are also a part of an antigenic site are presented as spheres. The analogue of the α2,6 host cell receptor is shown in black bond-sticks representation. The figure was made using PyMOL (The PyMOL Molecular Graphics System, Version 1.5 Schrödinger, LLC).

