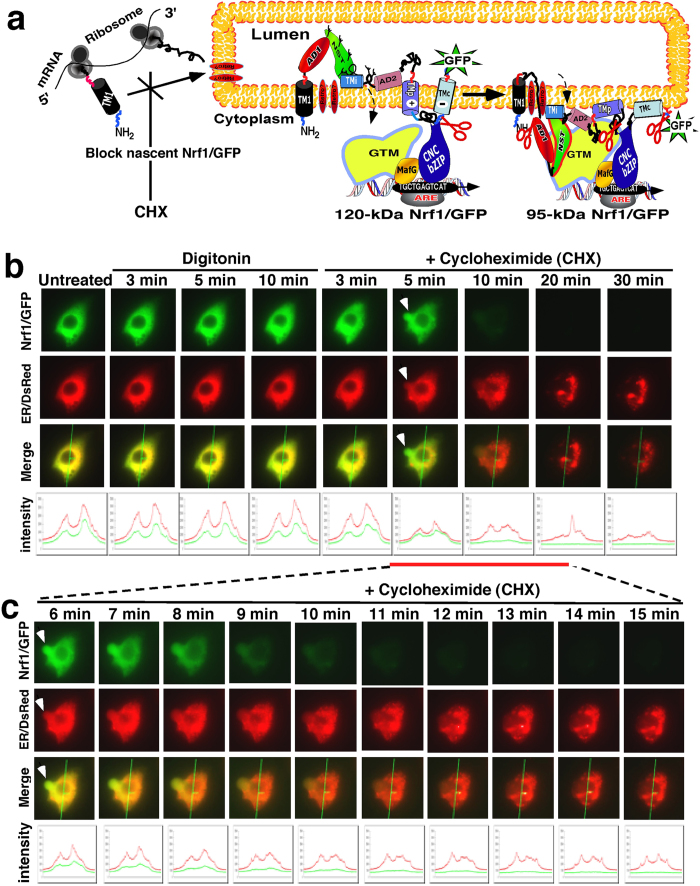
Figure 10. Live-cell imaging of the pre-existing Nrf1/GFP turnover following cycloheximide treatment.
(a) Distinct membrane-topologies of the 120-kDa and 95-kDa Nrf1 proteins (that have been fused C-terminally by GFP) around and within the ER are schematically shown. The newly synthesized Nrf1 protein from ribosomes can be blocked by cycloheximde (CHX). (b) COS-1 cells co-expressing Nrf1/GFP and the ER/DsRed marker were subjected to live-cell imaging combined with the chase experiment. The cells were permeabilized by digitonin (20 μg/ml) for 10 min, before being co-incubated with CHX (50 μg/ml) for additional 30 min. During the course of the experiment, real-time images were acquired using the Leica DMI-6000 microscopy system. The merged images of Nrf1/GFP with ER/DsRed are placed (on the third row of panels), whereas changes in the intensity of their signals are shown graphically (bottom). The features of arrow-indicated cells are described in the main text. Overall, the images shown are a representative of at least three independent experiments undertaken on separate occasions that were each performed in triplicate (n = 9). (c) Additional live-cell imaging of Nrf1/GFP was acquired from 6 to 15 min after co-incubation of CHX with digitonin, as described above.

