
Figure 3. Actual and counterfactual rates for secondary outcomes.
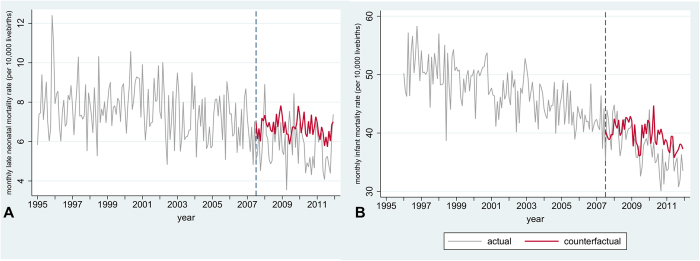
Actual rates are based on all registered live-births in England for infant mortality (n = 10,238,950) and on all babies alive at day seven after birth for late neonatal mortality (n = 10,207,750). Counterfactual rates are model-predicted rates based on a complete case scenario but without impact of smoke-free legislation (n = 9,911,272 for late neonatal mortality, n = 9,933,349 for infant mortality). Only outcomes where smoke-free legislation had a significant impact are shown. A: late neonatal mortality (n = 9,911,272); B: infant mortality (n = 9,933,349). Models are adjusted for non-linear time trends, month, maternal age, maternal marital status, sex, birth weight, socioeconomic status, region, and urbanisation level and based on complete cases. Dotted line represents introduction of smoke-free legislation. Note different scales on Y-axis.