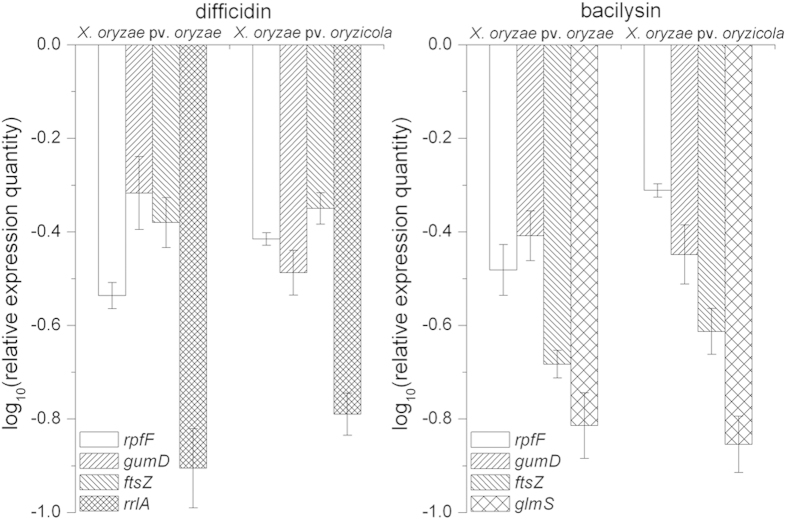
Figure 5. Quantitative real-time PCR analysis of expression of five genes (rpfF, gumD, ftsZ, glmS, rrlA) in Xanthomonas cells in response to difficidin and bacilysin treatment.
Values were normalized to the levels of 16S rRNA, an internal reference gene. The y-axis represents mean expression values ± SD relative to the control. The experiment was independently repeated five times.

