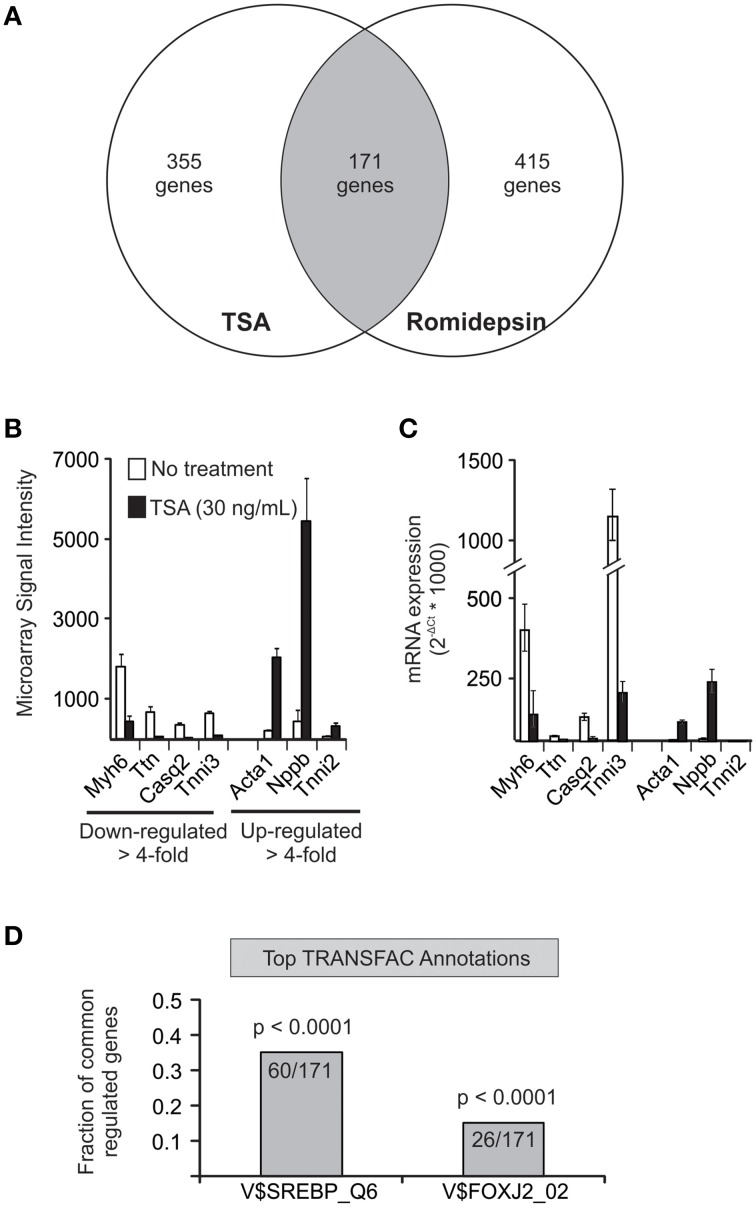
Figure 4.
BeadArray profiling reveals a potential role for cholesterol and SREBP. (A) Venn diagram illustrating the number of genes specifically changed (≥4-fold increase or decrease). Analysis using GATHER software (Chang and Nevins, 2006) focused on the common gene set that was altered by both compounds. (B) Shown are the BeadArray signal intensities of seven transcripts that are included in the top gene ontology hit (GO0006936: muscle contraction). (C) Expression changes were confirmed in 5 of 7 genes tested by qRT-PCR. (D) Annotation of common gene set for transcription factor binding sites (TRANSFAC, v8.2) revealed a putative role for SREBP in 60 out of 171 genes annotated.

