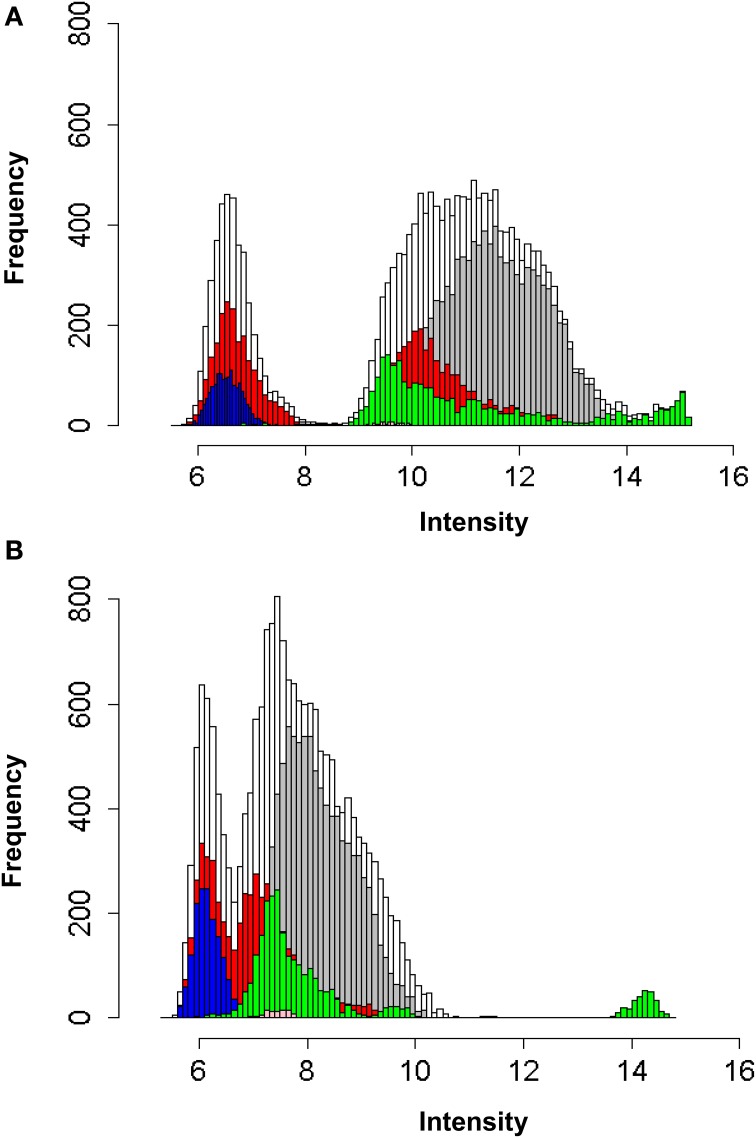
Figure 1.
(A) Log2 frequency of distribution of fluorescence intensities of all protein, positive and negative control array entities using Cy3 labelled anti-human IgG antibody. (B) Log2 frequency of distribution of fluorescence intensities of all protein, positive and negative control array entities using Cy5 labelled anti-human IgA antibody.  All combined data
  B. anthracis protein entities
  H. sapiens control protein entities (Alexa, AntiBiotin, Anti-human IgG, Biotin, BSA, Calmodulin, CMK, GST, Human IgG, Internal, Kinase, MAPKAP, V5Control)
  features labelled as ‘empty’ on the array
  features labelled as ‘blank’ on the array
  features labelled as ‘buffer’ on the array.

