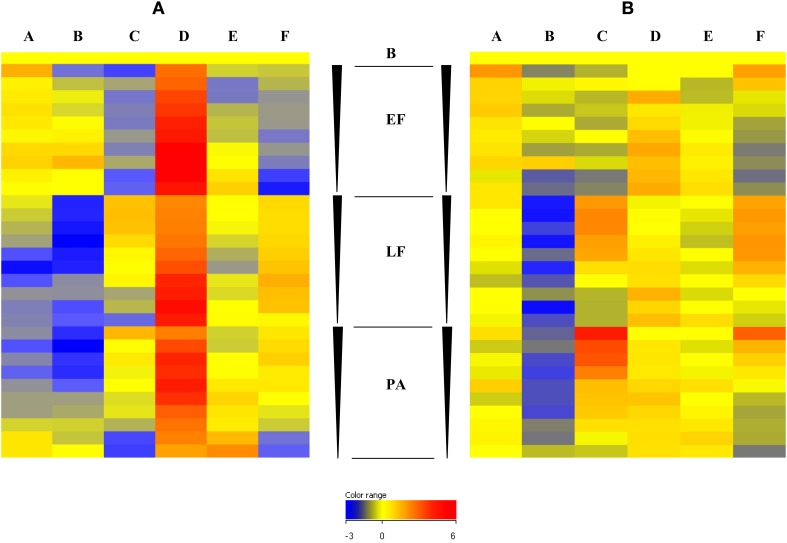
Figure 5.
Fluorescence intensity of B. anthracis anti-toxin IgG (I) and IgA (II) responses for edema factor (EF), Lethal factor (LF) and Protective antigen (PA) and buffer only control (B). A concentration gradient from 200 to 3.125 ng/μl was spotted on the array for each toxin protein, indicated by the block arrowheads, from highest (top) to lowest (bottom) concentration. (A) Negative controls (B) IVDU Anthrax negative (C) IVDU Anthrax positive (D) AVP vaccinees (E) Belgian Woolsorters (F) Turkish cutaneous Anthrax patients.

