Fig. 2.

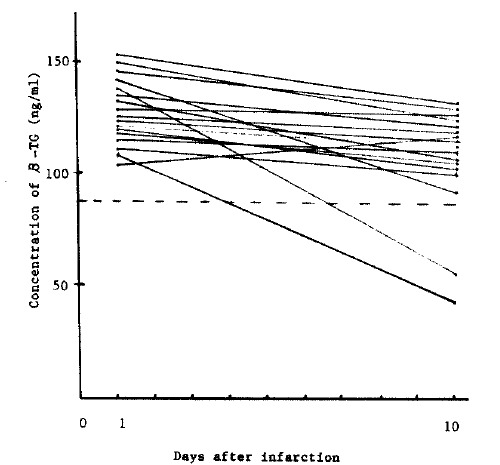
Changes in β-TG after the onset of myocardial infarction. The dotted line represents the level of 30 normal subjects ± 1S.D.

Changes in β-TG after the onset of myocardial infarction. The dotted line represents the level of 30 normal subjects ± 1S.D.