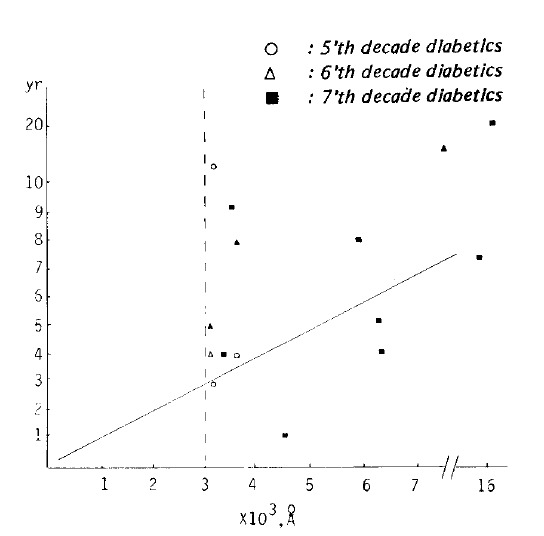
Fig. 2.

Correlation of duration (y) and subepidermal capillary basement membrane thickness (x) in diabetes. In a group of all durations and a subepidermal capillary basement membrane thickness of above 3000 Å, the equation describing the regression line was y = 0.7755 ± 1.1909 E−03 x (r = 0.7336).
