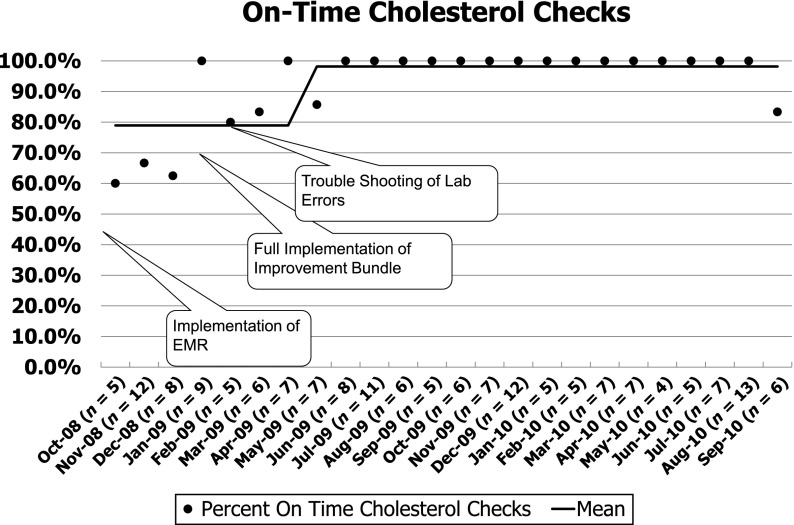
FIGURE 2.
Annotated Run chart of our primary measure for improved cholesterol monitoring. Each point represents the percentage of visit where indicated cholesterol testing was performed. The line indicates the mean. The annotations mark interventions and external factors that may influence our system.

