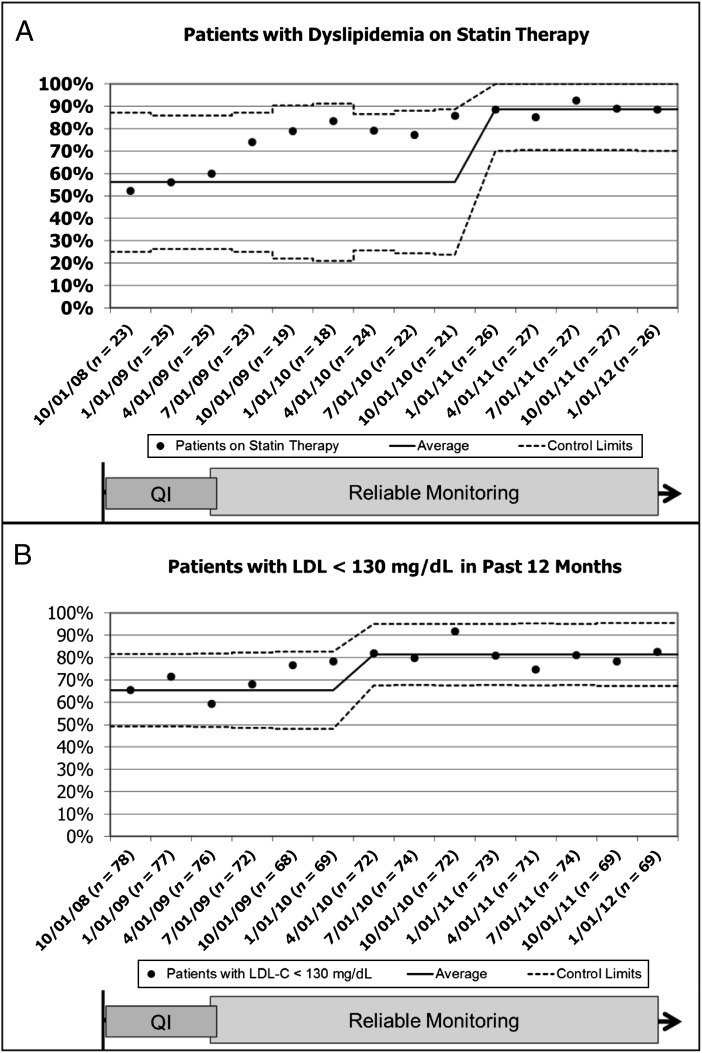
FIGURE 4.
Statistical process control chart of (A) the percentage of dyslipidemic patients >10 years treated with a statin and (B) the percentage of patients in our cohort with LDL <130 mg/dL (3.3 mmol/l) documented in the previous 12 months. Data are limited to patients ≥7 months out from kidney transplant. Baseline median and 3-σ control limits were based on data from October 2008 through April 2009 and were readjusted when special cause was achieved.

