
Fig. 1.
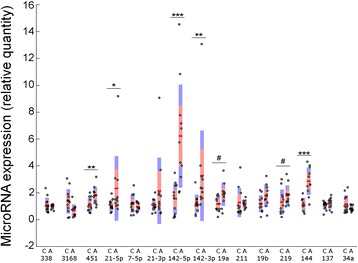
miR-451a, miR-142-5p, miR-142-3p, miR-144-3p, and miR-21-5p are overexpressed in the autism brain samples. Real-time PCR was performed on the first 15 microRNAs from the list in Table 1. The data is represented as box plots, with each dot representing an individual brain sample. The line identifies mean, and red and purple areas represent standard error of the means and standard deviation, respectively. In the x-axis, C = control and A = autism. Two-tailed students t tests *p < 0.05, **p < 0.01, ***p < 0.001. #p < 0.05 in one-tailed students t test