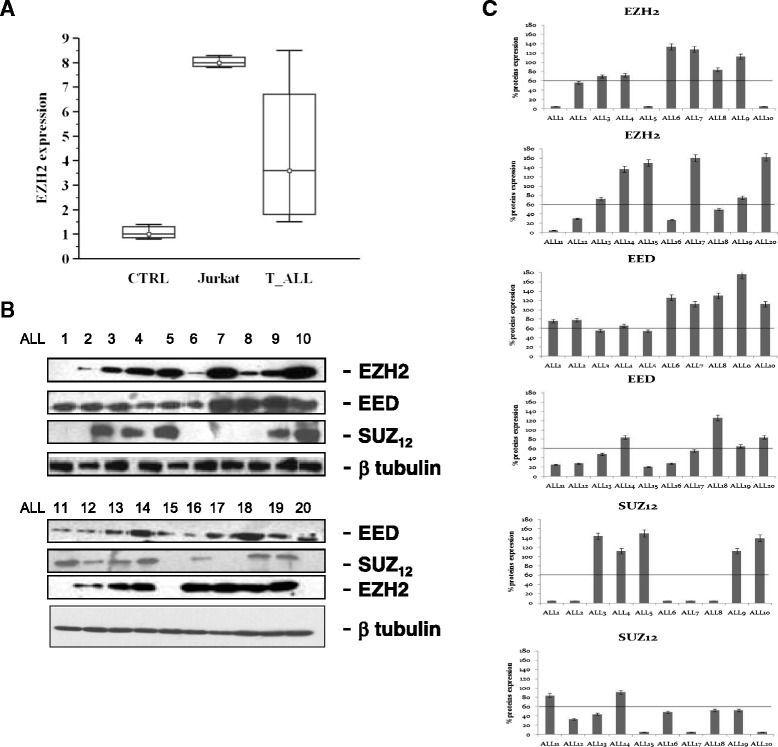
Fig. 1.

EZH2 Expression (a) EZH2 expression evaluated through real time PCR in sample control (CTRL), Jurkat and T-ALL samples. PRC2 expression evaluated through immunoblotting (b) in T-ALL samples enrolled in the study and (c) representation of the densities of the bands corresponding to EZH2, SUZ12 and EED expressed as percentage of expression after laser scanning
