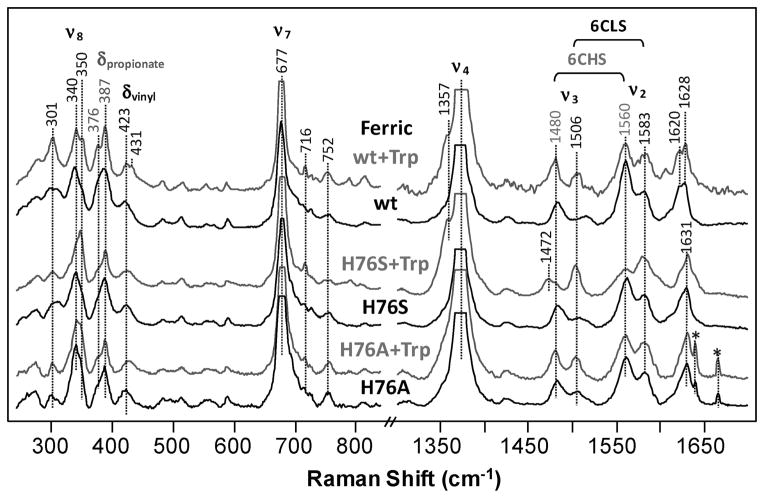
Figure 2.
Resonance Raman spectra of the ferric derivative of the H76S and H76A mutants of hTDO, with respect to the wild type enzyme, in the presence and absence of L-Trp. The small shoulder at 1357 cm−1 in the L-Trp bound wild type and H76S mutant is a result of a small amount of photoinduced reduction of the ferric heme. The protein concentrations are ~25–40 μM. The protein solutions were buffered at pH 7 with 100 mM phosphate. The concentration of L-Trp was 20 mM. The excitation wavelength for the Raman measurements was 413.1 nm and the laser power was ~5 mW. The sharp peaks labeled with asterisks are the plasma lines from the laser.

