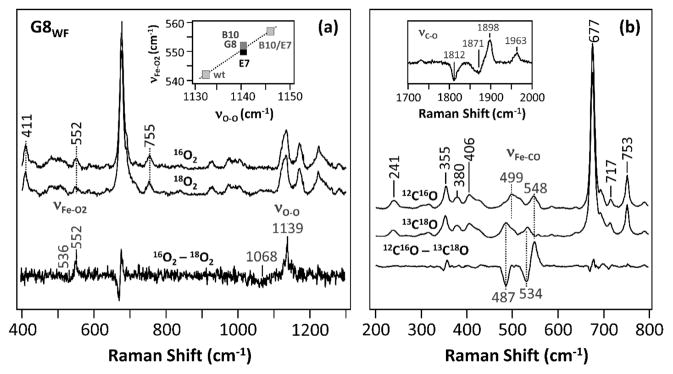
Figure 1.

Resonance Raman spectra of the O2 (a) and CO (b) adducts of the G8WF mutant of Ctb. The data associated with the natural abundant and isotope-labeled ligands and the isotope-difference spectra are as indicated. The inset in (a) shows the correlation between νFe–O2 and νO–O.
