Fig 3.

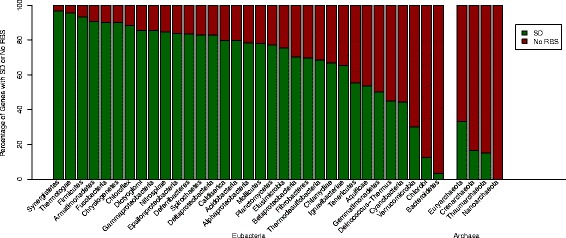
Comparison of Distribution of Genes with SD or No RBS among Different Bacterial Groups. The data is organized into various prokaryotic groups and separated into two larger groups, Eubacteria and Archaea

Comparison of Distribution of Genes with SD or No RBS among Different Bacterial Groups. The data is organized into various prokaryotic groups and separated into two larger groups, Eubacteria and Archaea