
Fig. 6.
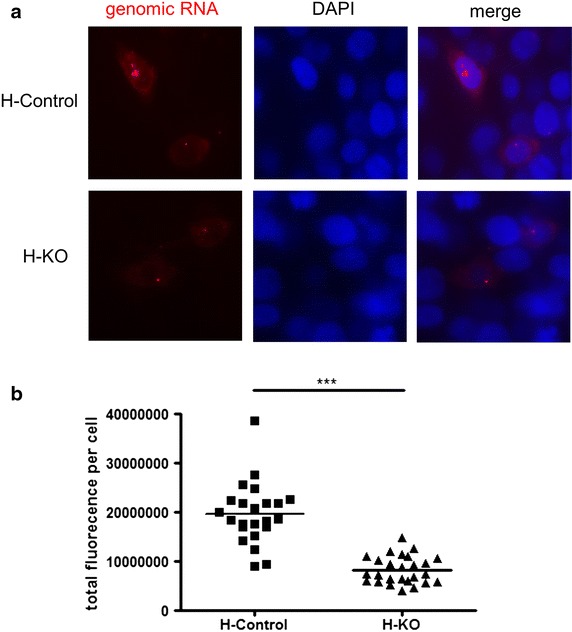
RNA FISH analyses of HIV infected HAP1 cells. a The same number of either HAP1 control cells or HAP1 knockout cells was infected with pseudotyped HIV. 24 h after infection, the supernatant was removed and the cells subjected to RNA FISH analysis by fluorescence microscopy. b The area of each individual genomic RNA positive control or knockout cell was defined and the fluorescence intensity was quantitated using image J. A total number of 23 or 26 cells, respectively, was identified from either control cells or knockout cells in two experiments. The statistics were done using unpaired two-tailed Student t test with the statistical significance shown by asterisks.