Fig. 1.

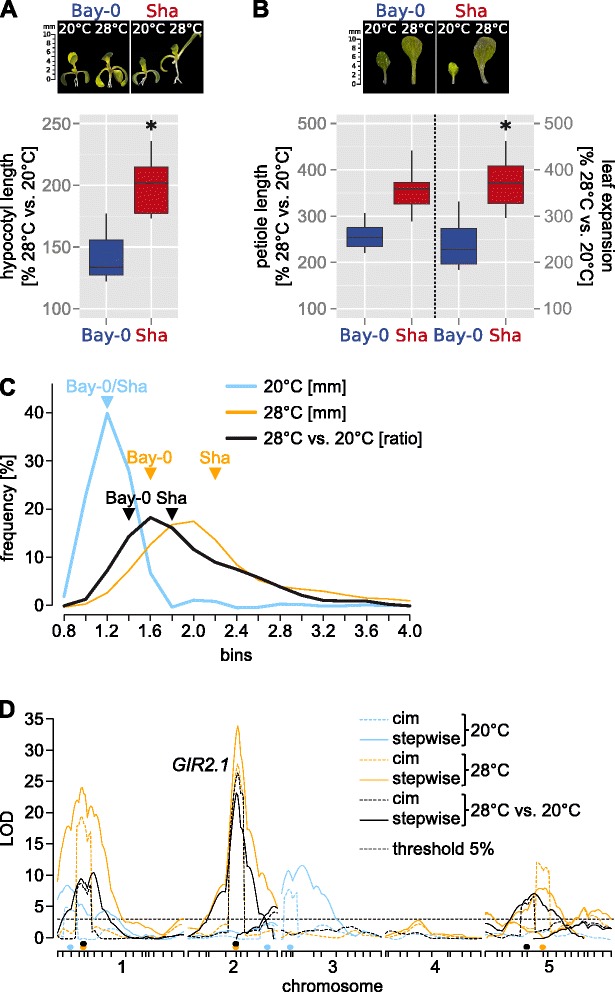
Quantitative trait locus analysis of temperature-induced growth responses in Arabidopsis thaliana. a Relative hypocotyl length (28 °C/20 °C in %, n = 15) of 10 days-old A. thaliana accessions Bay-0 and Sha. b Relative petiole length and leaf expansion of 12 days-old seedlings. a,b Box plots show medians (horizontal bar), interquartile ranges (IQR, boxes), and data ranges (whiskers). Black dots mark outliers (defined as > 1.5 × IQR). Asterisks mark significant differences in temperature responses (P < 0.05) as assessed by two-way ANOVA (i.e. genotype x treatment effect) of the absolute data presented in Additional file 1. c Frequency plot of phenotypic classes observed in a Bay-0 x Sha-derived recombinant inbred line population for hypocotyl length of 10 days-old seedlings grown at 20 °C (n = 400) or 28 °C (n = 395), and for the ratio of 28 vs. 20 °C (n = 387) means. Parental phenotype classes are indicated to illustrate the transgression effects within the population. d LOD scores (y axis) from composite interval mapping (cim) and multiple QTL mapping (stepwiseqtl) are plotted against all chromosomes (x axis). Tick marks on the x axis correspond to molecular markers in the genetic map. Colored dots on the x axis show co-variates set for cim. Thresholds are based on 1000 permutations and an alpha of 0.05. The 28 °C vs. 20 °C GIR2.1 QTL, which is the subject of this study, is highlighted
