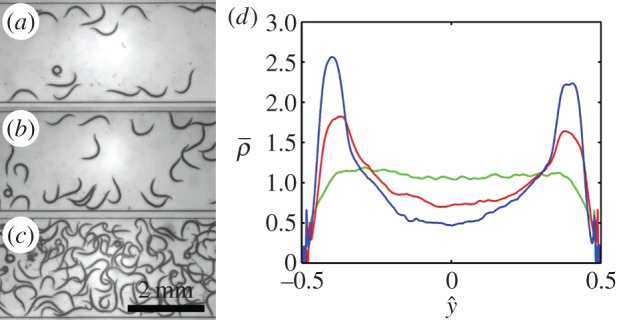
Figure 2.

Surface attraction of C. elegans when in a swarm. Images of swarms of animals in a conduit when the area fraction occupied by the animals is Φ = 0.04 (a), 0.07 (b) and 0.28 (c). (d) The time-averaged, probability distribution function  of finding an animal at
  transverse to the surface, as a function of
  when Φ = 0.04 (blue line), 0.07 (red line) and 0.28 (green line).
