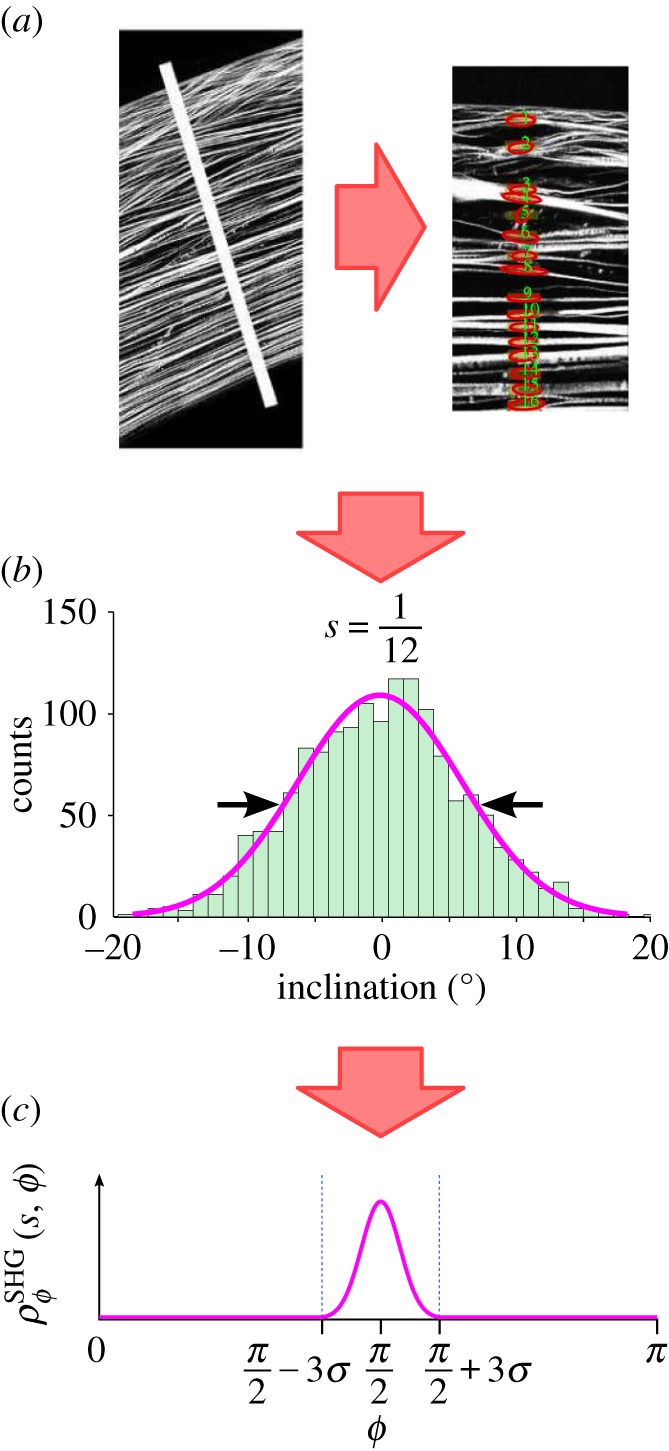
Figure 5.

SHG images were processed by Winkler et al. [37] to obtain quantitative depth-dependent inclination distributions. Images were scanned for lamella direction by first isolating a narrow section of the image and rotating it so the anterior surface was horizontal. Then the image processing algorithm searched for fibres by scanning through the depth. Data were processed to discard artefacts and then plotted in a histogram for each depth. A Gaussian distribution was fit to the data to define the FWHM value for each depth and radial position. The FWHM value was then used to define the inclination distribution  (Online version in colour.)
