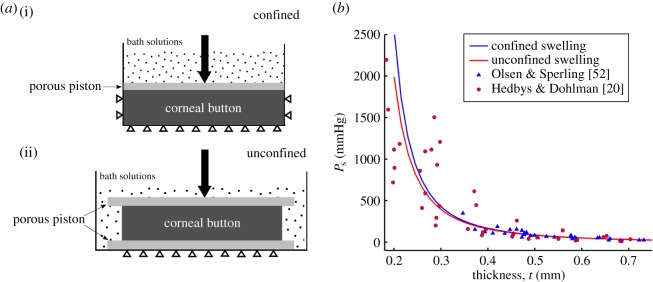
Figure 7.

(a) Illustrations of confined (i) and unconfined (ii) swelling pressure experiments for ex vivo cornea, respectively [20,52]. In both experiments, a mechanical pressure needs to be applied in the transverse direction to maintain a specified thickness. (b) The predicted confined and unconfined swelling pressure Ps versus corneal thickness t and their comparison with experimental measurements [20,52] over thickness range  The swelling pressure data have been extracted from the original papers by free graphics software Plot Digitizer, and the hydration data H from [20] have been transformed to thickness t by the observed linear relation H = 7.09t − 0.44 [52,53]. (Online version in colour.)
