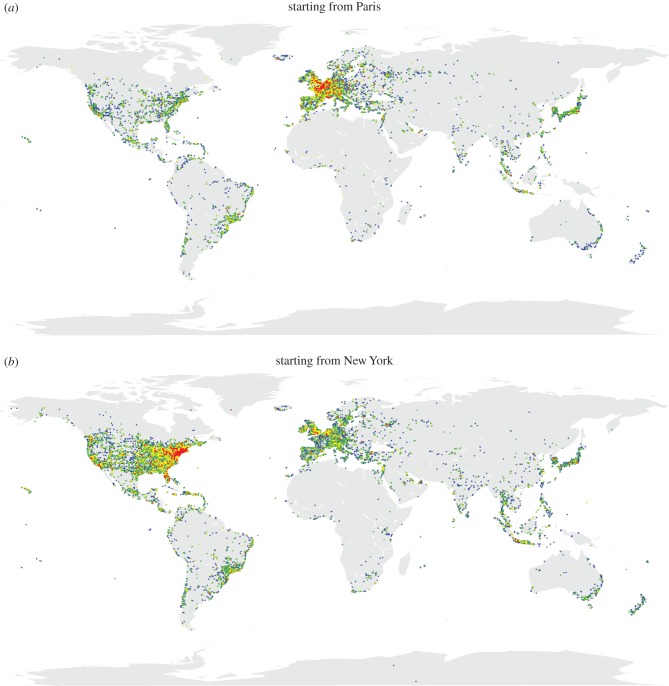
Figure 2.
Geolocated tweets of users who have been at least once in Paris (a) and New York (b). The colour changes according to the number of days Δt since the first passage in the city. In red, 1 day; in yellow, between 1 and 10 days; in green, between 10 and 100 days; and in blue, more than 100 days.

