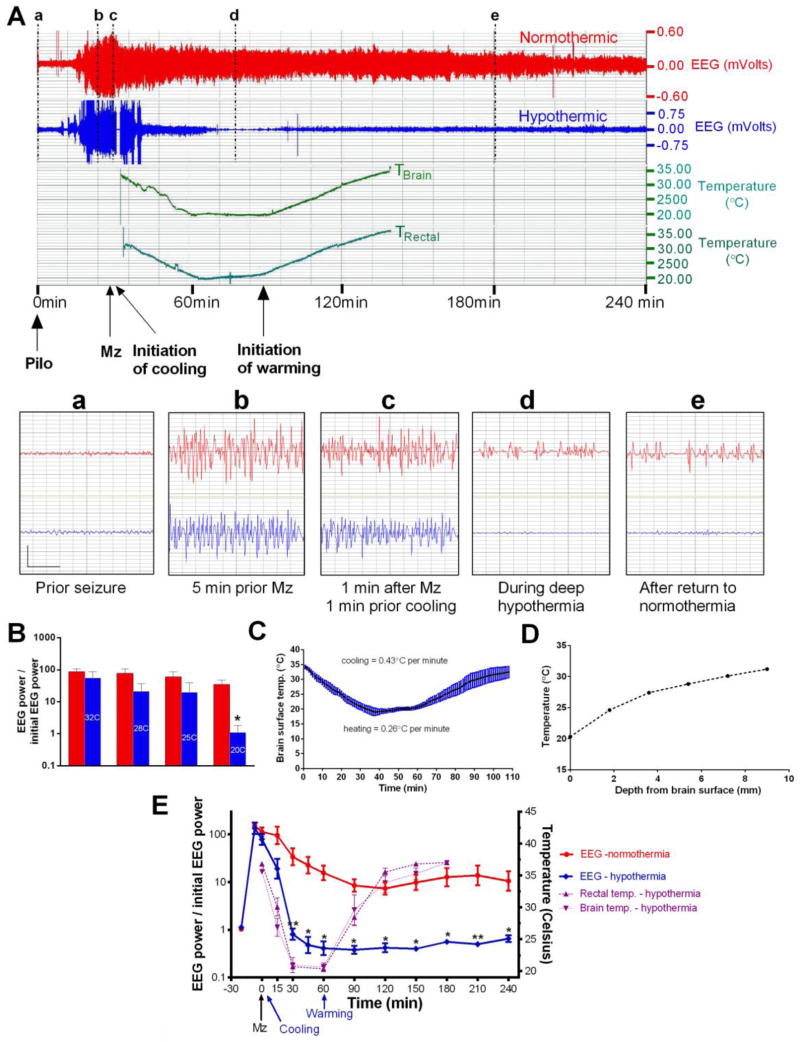
Figure 1. Deep cooling durably reduces relative EEG power.
A) The upper panel shows the compressed 4-hr EEG of a normothermic (red) and a hypothermic rat (blue, 20ºC for 30 min.) with brain and rectal temperature. Both rats received midazolam 3 mg/kg ip (arrow) and cooling was initiated 2 min later. The lower panel shows the magnified 4-sec EEG traces marked by vertical lines (a–d) (vertical bar = 0.75 mV; horizontal bar = 1sec).
B) Relative EEG power (EEG power/baseline EEG power) in normothermic (red bars) and hypothermic rats (blue bars, temperature in degrees Celsius) at the same time points. Relative EEG power was reduced by hypothermia in a dose-dependent fashion. The 20º C point and the slope were significantly different from normothermics (* p<0.01).
C) “Brain surface” temperature during cooling and re-warming.
D) Brain temperature as a function of electrode depth with the “cool cap” method. Steep temperature gradients suggest that deep structures such as the hippocampus may remain warmer than the cortical surface.
E) The left y-axis of this graph shows the ratio of EEG power at each time points to initial EEG power at baseline, before pilocarpine injection. Note the logarithmic scale. Every time point beyond 30 min. showed a significant difference between normothermic and hypothermic rats (** p < 0.01; * p < 0.05). The right y-axis shows the rectal and brain temperature scales. Note that the temperature of a probe positioned at the surface of parietal cortex was close to the rectal temperature.

