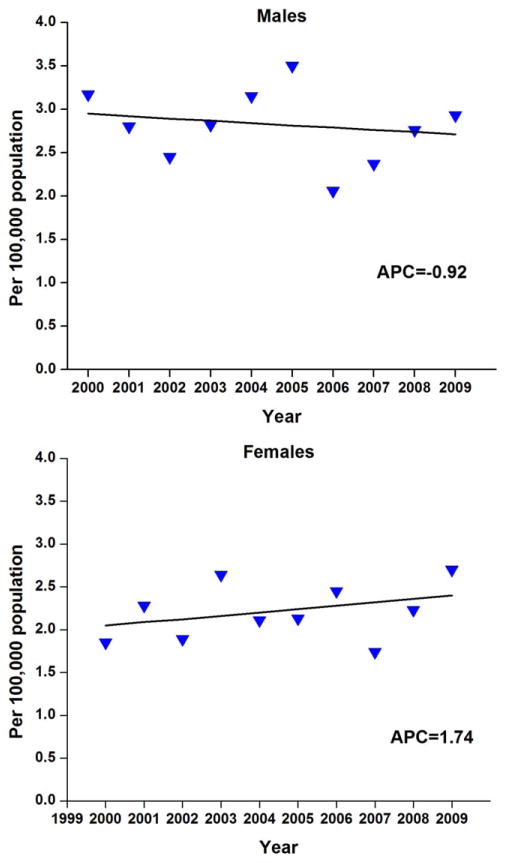
Figure 2.
Temporal trends in age-adjusted incidence rates of anal cancer are shown for 417 men and 378 women in the San Francisco/Oakland Cancer Registry between 2000 and 2009. APC indicates annual percent change. Triangles represent observed rates and the solid line represents the modeled rates based on log-linear regression. The asterisk indicates P <.05.

