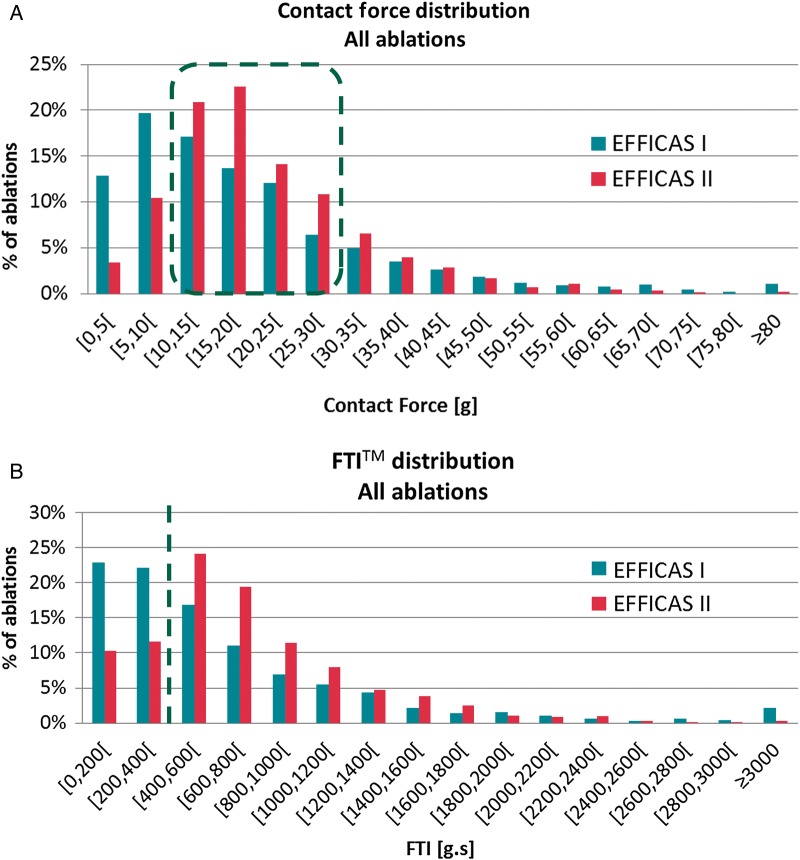
Figure 5.
Distribution of CF and FTI. (A) Comparison of CF distribution in EFFICAS I (1856 ablations) and EFFICAS II (1372 ablations). Red dots highlight the global percentage of ablations within EFFICAS II recommended CF range (10–30 g). This percentage significantly increased from 49 to 68% between both trials (P < 0.001). Proportion of low CF ablations (<10 g) reduced from 33 to 14%, and high CF ablations (>30 g) was 18% for both trials. (B) Analogous distribution of FTI. The red dots segregate low FTI (<400 g s) vs. EFFICAS II recommended range (>400 g s). Proportion of low FTI decreased from 45 to 22% of ablations between both trials (P < 0.001).

