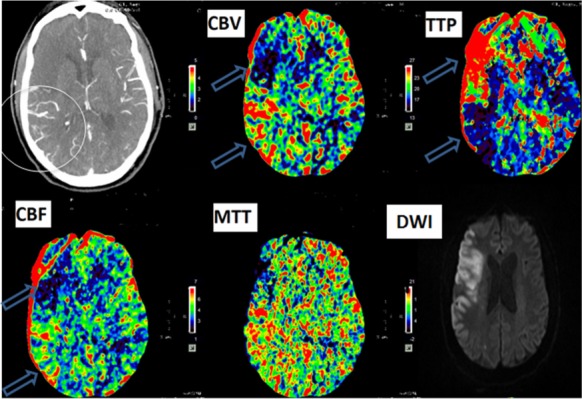
Figure 1. Hyperperfusion after recanalization in right MCA occlusion patient. Post-thrombolysis CT perfusion show dilated blood vessels (white circle) due to successful recanalization corresponding to decrease time to peak (TTP), increase cerebral blood flow (CBF) and cerebral blood volume (CBV) in the posterior aspect of the frontal lobe (upper blue arrow) due to hyperperfusion postrecanalization. In the anterior aspect of the frontal lobe, an increase in TTP and reduced CBF and CBV secondary to failed recanalization implies completed infarct. The diffusion-weighted imaging (DWI) confirms the corresponding infarct (cytotoxic edema) in the area with reduced perfusion (upper blue arrow), whereas the lower aspect of the frontal lobe (lower blue arrow) was spared from infarction due to hyperperfusion from successful recanalization.

