
Figure 6.
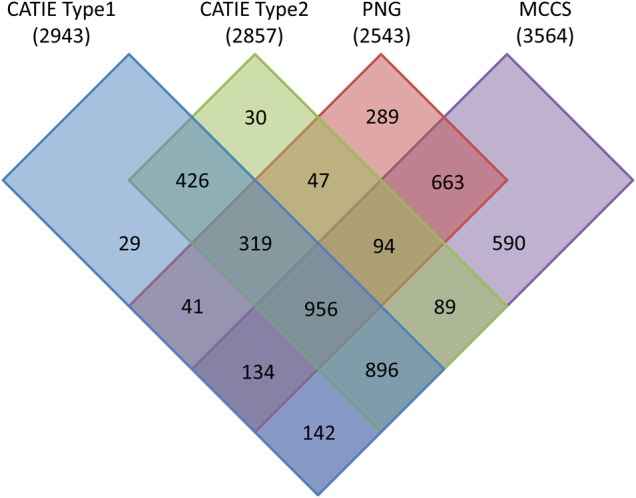
Venn diagram detailing the number of SNP markers that can be mapped, i.e. those with at least one heterozygous parent, in a particular population. The population name is listed above with the total number of markers that can be mapped in parenthesis. Markers that segregate within each population are represented by a coloured rectangle: CATIE Type 1 markers in blue, CATIE Type 2 markers in green, PNG in red and MCCS in purple. Overlapping rectangles indicate markers shared between those populations. Numbers within rectangles represent the number of markers that can be mapped within those population(s).