Figure 2.
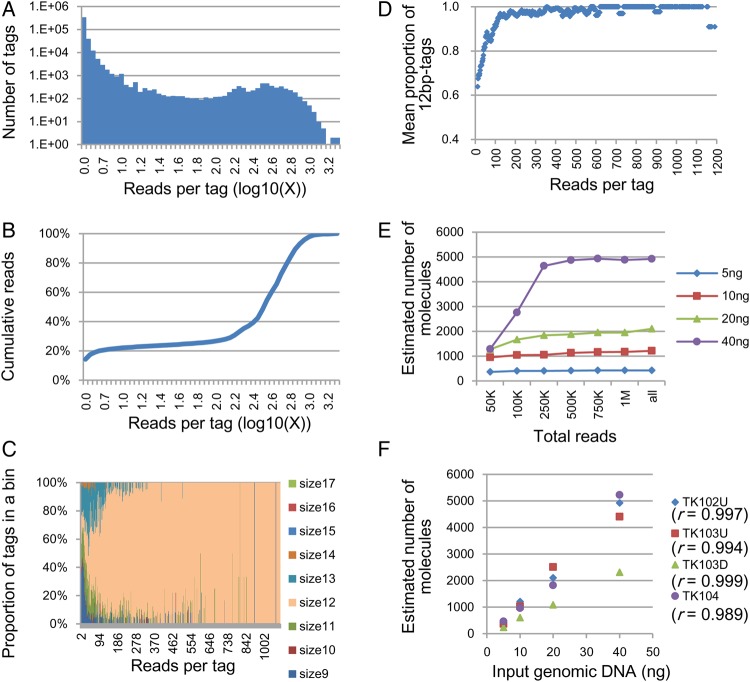
Monitoring the errors in the barcode sequence tags and absolute quantitation of target molecules. Results from Ion Proton sequencer data. The target region is TK102U, except in F. (A–D); results obtained using 40 ng of genomic DNA. (A) Distribution of reads per barcode tag. Vertical axis: number of different barcode tags. Horizontal axis: number of reads per tag, given as the common logarithm of the number. (B) Cumulative reads. (C) Proportions of barcode tags by size. (D) Mean proportion of 12-bp barcode tags after including the 11-bp and 13-bp tags that only differed from a 12-bp tag by the insertion or deletion of a single base. The mean proportion represents the average of the proportions of the nearest 11 bins. (E) Estimated number of target molecules after the removal of erroneous tags. Horizontal axis: number of reads used for estimation; the reads were randomly selected from the entire population of reads (‘5 ng’: 1,457,760; ‘10 ng’: 2,251,133; ‘20 ng’: 2,245,038; and ‘40 ng’: 2,395,763 reads). (F) Correlation between the number of molecules and the amount of input DNA after removal of the erroneous tags.

