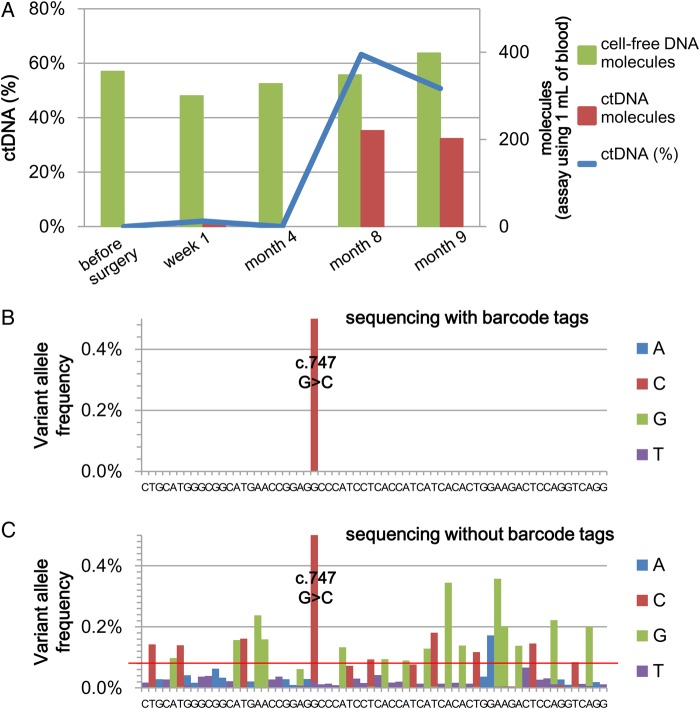
Figure 5.
Dynamics of ctDNA during the disease progression of a gastric cancer patient revealed using the NOIR sequencing system. (A) The levels of the TP53 mutant fraction in the cell-free DNA, that is ctDNA (%), and the number of total and mutation-positive molecules at various time points after the patient was operated on are displayed. (B and C) Fraction of calls not matching the reference sequence (Month 9): NOIR (B); deep sequencing, 1.7 total million reads (C). The red line indicates the criterion for variant detection proposed by Couraud et al.

