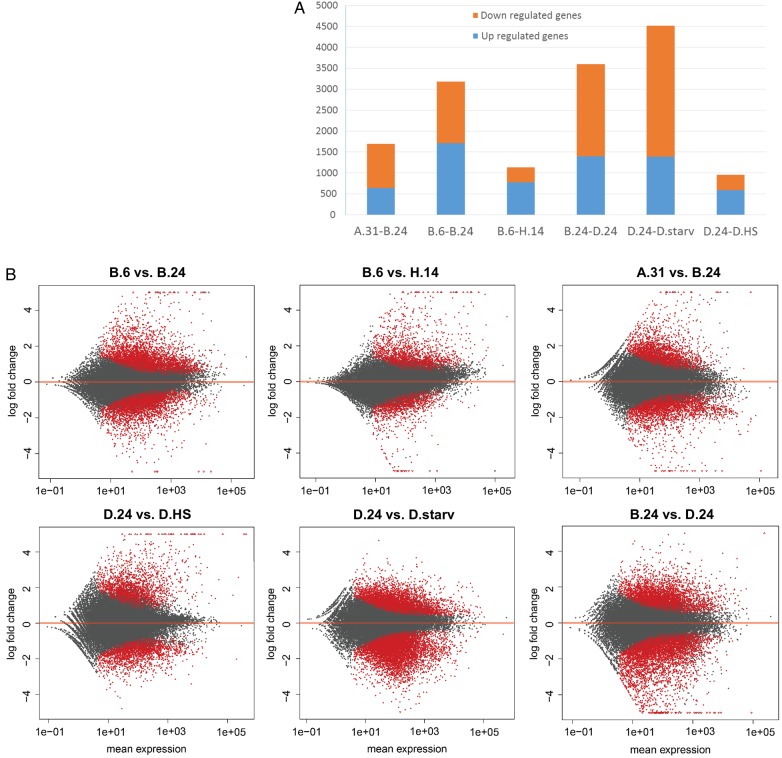
Figure 2.
MA plots of mean differential gene expression. (A) The number of DEGs between individual comparisons (FDR ≤ 0.01). (B) MA plots of fold change expression level (y-axis) against expression level (x-axis). Each point represents a transcript; those with significant differential expression (FDR ≤ 0.01) are indicated in red. The cultures compared are indicated above each plot. A summary of all possible comparison between cultures can be found in the Supplementary Fig. 2.

