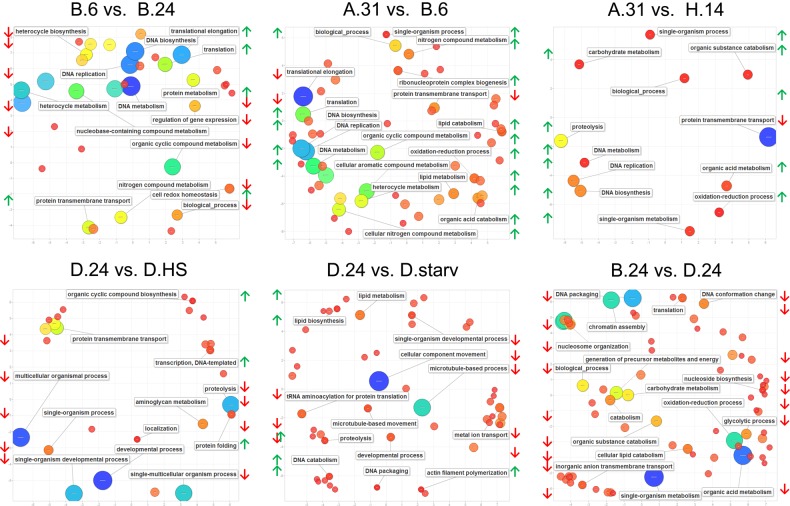
Figure 4.
GO enrichment analysis results. Principal component analysis (PCA) scatter plots of GO representatives of biological processes generated by the REVIGO tool that summarizes the list of differential expressed GO terms (FDR ≤ 0.02) by removing redundant terms.25 The distance between circles (representing individual GO terms) indicates the relationship between terms: closer distance means closer relationship. Bubble colour indicates significance of differential expression of an individual GO term (red low and blue high); the size (in log10 P-value) indicates the percentage of genes annotated with a term in the reference database (UniProt) and thus indicates more general terms (large) and more specific ones (small). Most significant terms are labelled in the individual plot as well as representatives for groups of terms with lower significance. Green and red lateral arrows indicate the direction of regulation (up or down).

