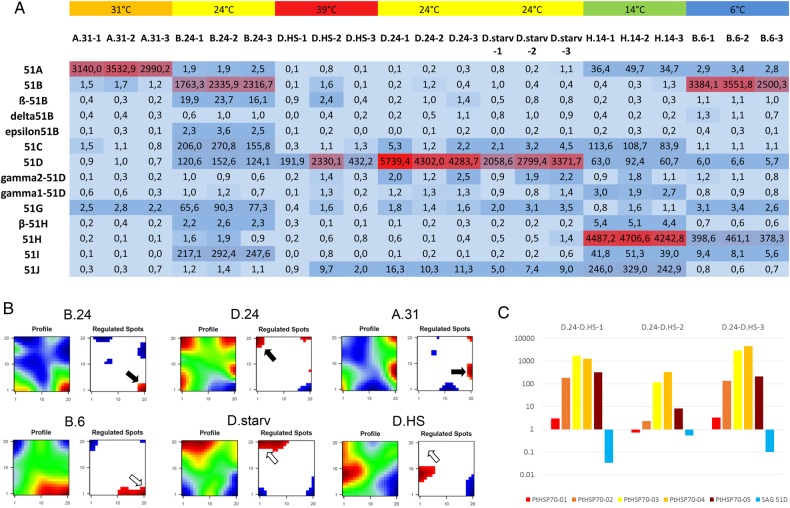
Figure 6.
Expression level of SAgs. (A) TPM normalized expression values for members of the SAg multigene family are shown in the table, and colour shading indicates relative expression level (dark blue—low, red—high). (B) Identification of regulated spots (gene clusters showing co-regulation in all analysed samples) in serotype pure cultures. Plots on the left show the global profile, plots on the right show regulated spots. (blue—low expression, red—high expression). The samples are indicated above the plots, a representative replicate is shown. Black arrows indicate the regulated cluster containing exclusively the actual expressed SAg (SAg 51B in B.24; SAg 51D in D.24; SAg 51A in A.31). The open arrows in the second row (B.6, D.starv, D.HS) indicate the position of the regulated spot of the cultures origin (B.24; D.24 and D.24). (C) Fold change expression level of cytosolic HSP70 isoforms and the 51D surface antigen gene of the individual three replicates of the heat-shocked cultures.

