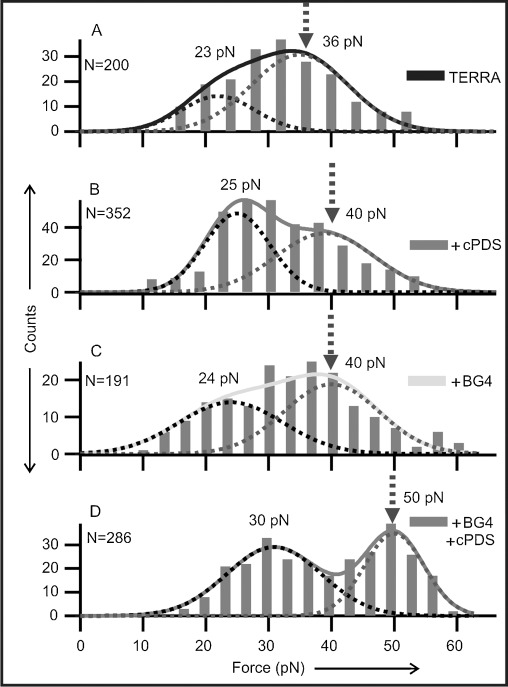
Figure 4.

Rupture-force histograms for TERRA G-quadruplexes without ligands (A), with 5 μm cPDS (B), with 50 nm BG4 (C), or with 5 μm cPDS+50 nm BG4 (D). Gaussian fitting (dotted curves) reveal two major populations. The higher force populations are indicated by dotted arrows.
