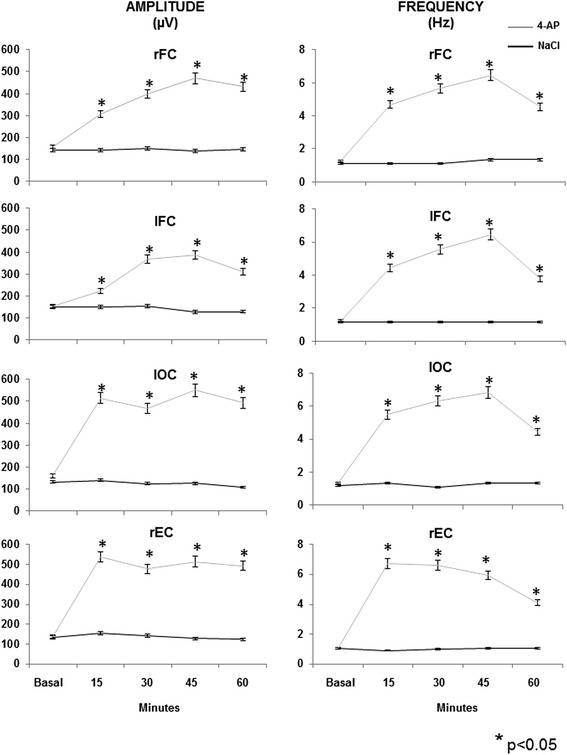
Fig. 2.

The graphs represent the mean (±SEM) of the different EEG amplitude and frequency parameters in the right entorhinal cortex (rEC), right and left frontal cortex (rFC and lFC, respectively) and left occipital cortex (lOC) of the control (NaCl, 0.9 %) and experimental (4-aminopyridine, 4-AP, 10 nmol) groups during basal activity and at different times after drug administration. Symbols represent: *p< 0.05 vs. control group
