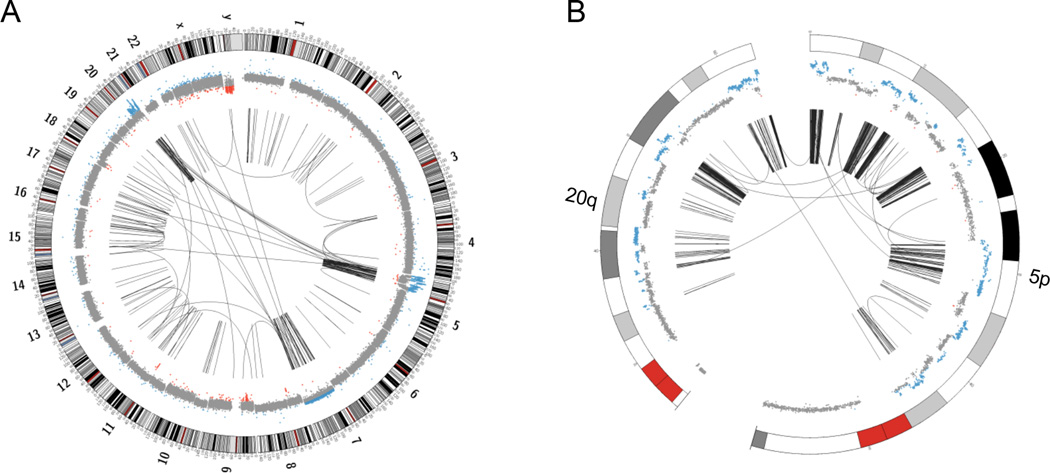
Figure 3. Whole genome circos plots of case number 14. The outer ring shows ideograms of the chromosomes, the inner ring represents the respective copy number changes. The arcs in the center indicate chromosomal rearrangements joining the two relevant genomic regions of each rearrangement.
(A) A whole genome circos plot, showing massive inter- and intrachromosomal rearrangements, predominantly involving regions of chromosomes 5 and 20. (B) A zoomed in version of the circos plot depicting the most affected regions of chromosomes 5p and 20q.

