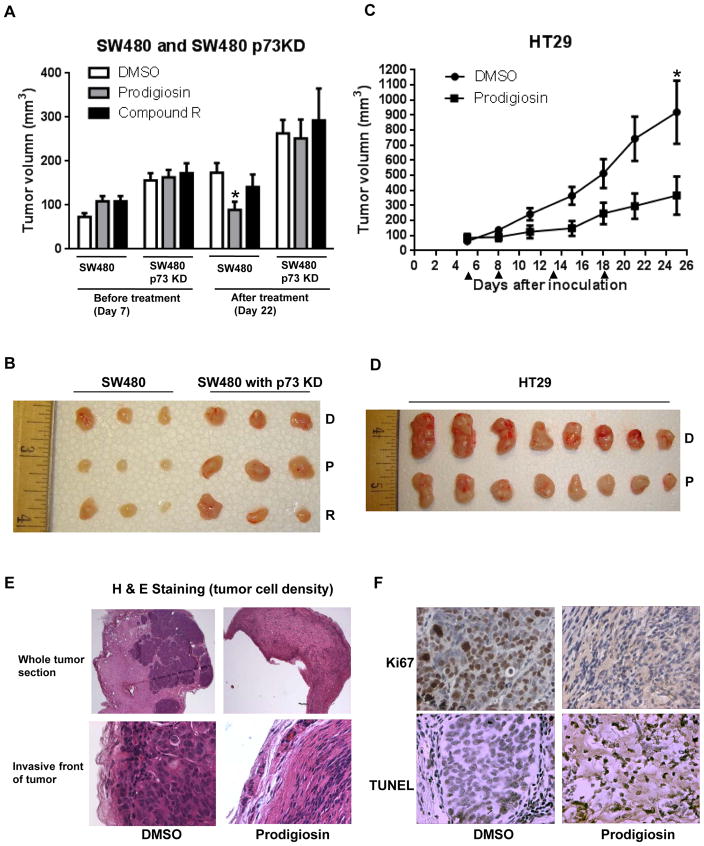
Figure 7. Prodigiosin inhibits tumor growth in vivo.
(A), SW480 xenografts and SW480 p73KD xenografts were treated with 5mg/kg prodigiosin, compound R or DMSO every 4 days for a total of three treatments. The mean tumor volume ± SEM before treatment and after treatment is shown (* P < 0.05 by unpaired t-test). (B), Image of three representative tumors from each group (SW480 xenografts and SW480 p73KD xenografts). (C), HT29 xenografts were treated with 5mg/kg prodigiosin and DMSO control for four times. The arrows show the days of the treatment. The mean tumor volume ± SEM is shown (* P < 0.05 by unpaired t-test). (D), Imaging of tumors from each group (HT29 xenografts). The tumors were excised at the end of the experiment (day 25 after inoculation). (E), H & E staining shows that prodigiosin treatment decreases tumor cell density in the whole tumor section and the invasive front of tumor. (F), Ki67 and TUNEL staining.

