
Figure 1. Identification of delphinidin 3-sambubioside-5-glucoside.
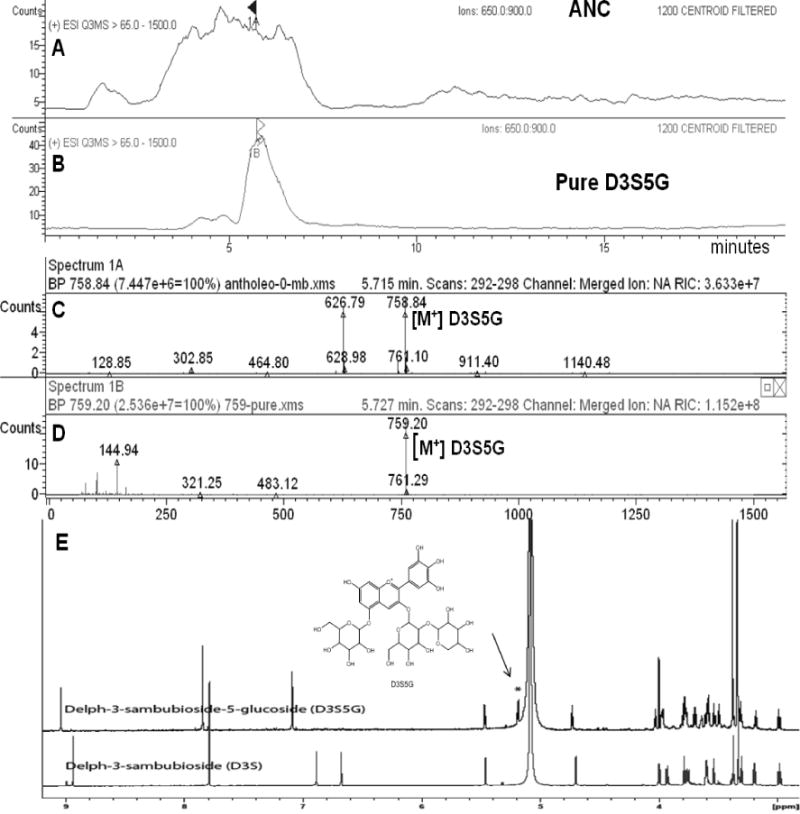
LC-MS showing the extracted ion chromatograms in the range of m/z 650 to 900 of: (A) ANC, (B) D3S5G; (C) Mass spectrum (positive ion mode) extracted at retention time 5.7 min of ANC fraction showing mainly m/z 758.8 (D3S5G) and m/z 626.79 (D3G,5G); (D) Mass spectrum of the purified D3S5G m/z 759.2. (E) 1H-NMR spectrum of isolated D3S5G compared to reference standard D3S measured at 950 MHz. D3S5G shows an extra signal at δ 5.2 for the anomeric proton of the 5-glucose.